UOB Stock Drops 1.37% Today, Testing Support Level
On Agustus 18, 2026: price 41.13 SGD, trend sideways, RSI 43.4, support 41.70, resistance 43.89. technical analysis of uob stock. UOB Stock Drops — full…

United Overseas Bank slipped to SGD 41.13 on SGX, down from a previous close of SGD 41.70, as the shares extended a weak patch that has left them below key short-term trend markers. The move matters because it is not just a one-day dip: the stock is now trading beneath its SMA20 at 42.94, while the broader setup remains sideways, suggesting the market is still searching for direction rather than building a clean uptrend.
Trend & Price Action
The price structure is leaning soft. UOB is below both the SMA20 and just under the SMA50 at 41.46, which tells traders that near-term momentum has weakened enough to pull the share back into a contested zone. There is no fresh MA cross, so the chart is not showing a decisive trend reversal signal; instead, it is showing a market that has rolled over from the mid-range and is now testing whether buyers will defend the lower half of the recent band.
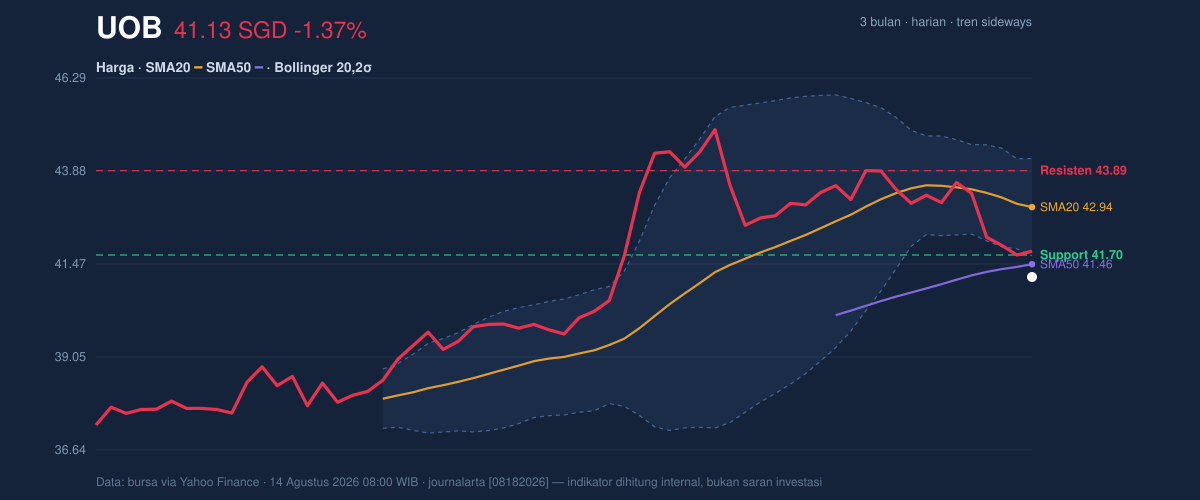
The Bollinger Bands help explain that tension. Price is sitting near the lower edge of the band structure, with the lower band at 41.68 and the stock at 41.13, which places it below the statistical range that has contained recent trading. In plain language, that means the market has already pushed into a stretched area on the downside, but the signal is not automatically bullish: a close below the lower band can also reflect persistent selling pressure when volume and breadth do not improve. The band width at 5.9% is also tight, so the chart is in a squeeze phase that often precedes a larger move. Squeezes do not predict direction; they simply warn that the next swing may be sharper than the recent drift.
Oscillators & Momentum
Momentum is mixed, and that mix is what keeps the stock from looking outright broken. The RSI at 43.4 is neutral, which means the shares are not oversold enough on its own to force a rebound, but neither are they in an overheated condition that would usually support a reversal lower. The more immediate signal comes from stochastics, where %K at 18.6 and %D at 9.3 show an oversold reading. That often signals that downside pressure has become short-term exhausted, yet oversold conditions can persist when trend and volume still point lower.
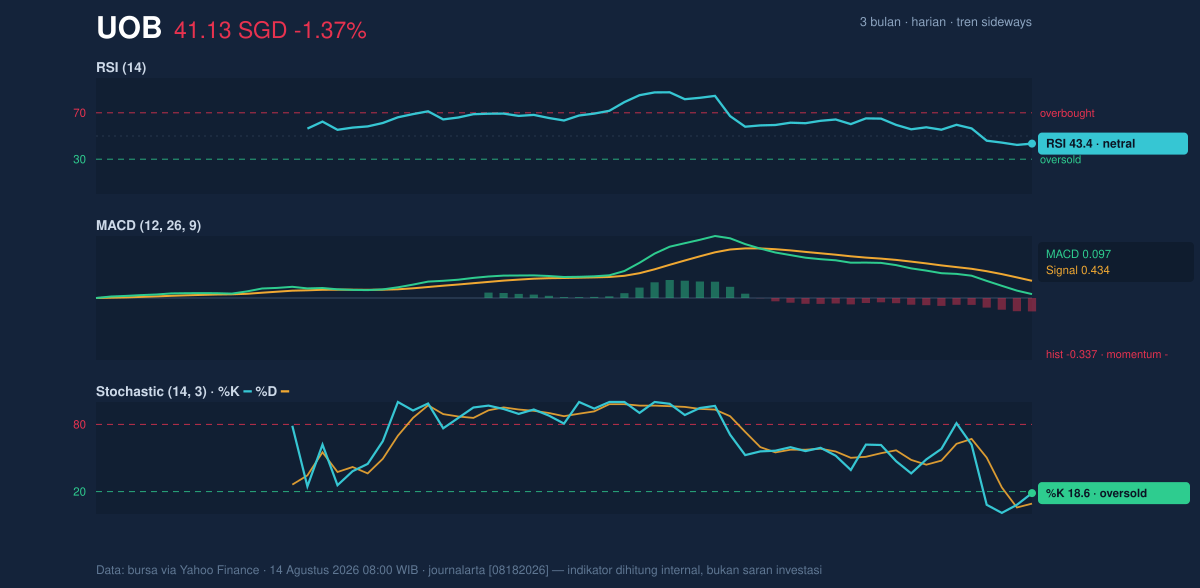
The MACD is less forgiving. With MACD at 0.097 below the signal line at 0.434 and the histogram at -0.337, the momentum picture remains negative. In practical terms, this means the recent price action is still losing speed rather than regaining it, even if the stock is close to a support area. When MACD is negative while stochastics are oversold, the chart usually says the same thing in two different ways: the stock may be near a tactical floor, but it has not yet proved that buyers are back in control.
Volatility & Volume
Volatility is moderate rather than extreme. The ATR at 0.74, equal to 1.8% of price, suggests the stock can move enough to matter without behaving like a high-beta name. That is important because the current Bollinger squeeze implies a potentially larger swing ahead, and ATR indicates the likely size of that swing is still manageable rather than disorderly.
Participation, however, is not yet convincing. Last volume was 3,287,308, below the 20-day average of 3,886,608, or about 0.8× normal. Lower-than-average volume during a decline usually weakens the bearish case for a strong breakdown, but it also weakens the bullish case for a durable rebound. The OBV is falling, which means volume flow has been leaning toward distribution rather than accumulation. Put simply, the market has been trading as if more shares are changing hands on downswings than on rallies, and that undercuts the idea that the recent weakness is merely a brief pause.
Key Levels & Scenarios
The nearest reference point is support at SGD 41.70, which is also close to the lower Bollinger band, making it a critical line for near-term sentiment. On the upside, resistance at SGD 43.89 stands out as the first meaningful barrier, and the SMA20 at 42.94 sits in between as a shorter-term recovery checkpoint. The stock is currently positioned at about the lower end of its recent range, with the chart showing it around -26% of that span, which reinforces the idea that it is not trading in the middle of a balanced range but nearer the weaker side.
If price can reclaim the 41.70 area and then push back above the SMA20 at 42.94, the chart would begin to look less fragile, especially if volume improves. If it fails to hold 41.70, the market would likely be signaling that the recent squeeze is resolving to the downside rather than into a recovery.
Technical Verdict: HOLD (wait & see)
HOLD (wait & see) fits best because the chart is caught between oversold short-term momentum and a still-negative trend structure.
- MACD is negative, so downside momentum has not yet fully reset.
- Stochastic is oversold, which warns that selling may be stretched and a bounce is possible.
- Price is below the SMA20 and volume is 0.8× normal, so there is no strong confirmation of a recovery yet.
- Invalidation condition: this verdict is invalidated if price breaks below SGD 41.70 and fails to recover, because that would weaken the nearest support and keep the bearish bias intact.
- Ideal Entry Range: SGD 41.70 to SGD 42.94
- Exit Target: SGD 43.89
- Stop Loss protection: below SGD 41.68
For non-traders, that means the share is close to a possible turning point, but the chart has not yet shown enough strength to call the next move with confidence.
Summary Data UOB
| Last price | 41.13 SGD |
| Change 1 day / 5 days / 1 month | -1.37% / -5.62% / -5.45% |
| Trend / MA-cross | sideways / none |
| SMA20 / SMA50 | 42.94 / 41.46 |
| RSI (14) / Stochastic %K | 43.4 / 18.6 |
| Bollinger %B / ATR | -22% / 0.74 |
| Support / Resistance 20 days | 41.70 / 43.89 |
| Data as of | 14 Agustus 2026 08:00 WIB |


