Alibaba Stock Analysis: Gains 3.68%, Testing Key Resistance
On Agustus 19, 2026: price 126.70 HKD, trend uptrend, RSI 61.6, support 110.00, resistance 128.10. technical analysis of alibaba stock.

Alibaba Group on the Hong Kong stock exchange rose to HKD 126.70, up 3.68% from the previous close, as the shares pushed deeper into the upper half of their recent trading range and approached near-term resistance, according to exchange data cited via Yahoo Finance.
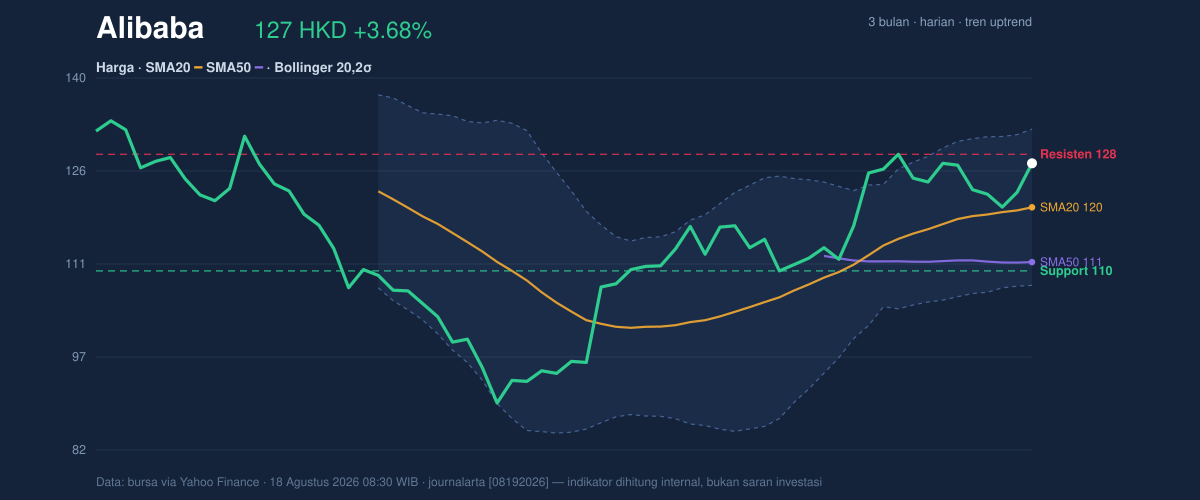
The move matters less for the headline gain than for what it says about positioning: Alibaba is still in an uptrend, with price sitting above both the SMA20 at HKD 119.88 and the SMA50 at HKD 111.37. That is the basic sign of an intact medium-term structure — the shorter average is above the longer one, and the share price is trading above both, which usually indicates that buyers have been willing to pay progressively higher levels. The catch is that momentum is no longer as clean as the trend. The stock is now near the top of its recent band, with the last price at 92% of the 20-day range and just below resistance at HKD 128.10. That means the market is testing whether the latest advance has enough force to break into a new leg higher, or whether it is simply stretching toward the top of the current channel.
The chart shows a constructive trend, but not a fully confirmed breakout.
Trend & Price Action
As shown in the chart, Alibaba is trading above the key moving averages, which usually tells investors the market is still rewarding the stock’s recent direction. The SMA20 slope of 1.55% over 5 days points upward, a useful sign that the short-term trend is still rising rather than flattening out. There is no fresh MA-cross, so the current setup is not being driven by a new moving-average signal; instead, it is being carried by price staying above the averages that already define the trend.
That said, the stock is no longer cheap in technical terms. The price is close to the upper edge of the Bollinger band structure, with the upper band at HKD 132.00 and %B at 78%. %B measures where price sits inside the band range; a reading near 100% means the stock is pressing the top band, which often reflects strength but can also mean the move is getting extended. In plain language: the rally is still alive, but it is closer to a point where traders begin to ask whether fresh demand is strong enough to keep chasing it.
Oscillators & Momentum
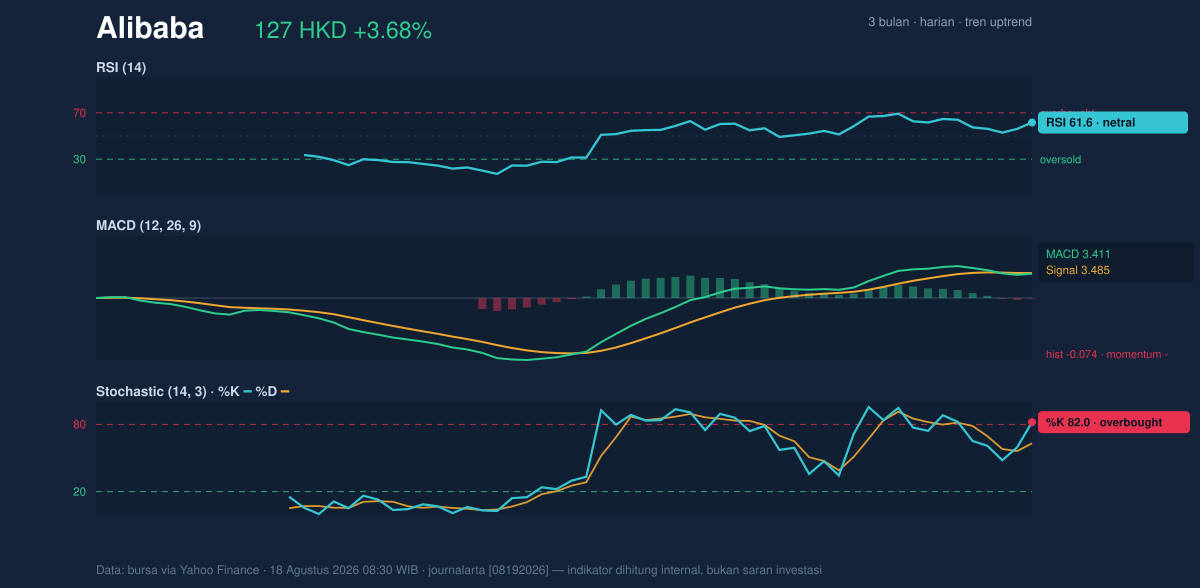
The momentum picture is more mixed than the price trend. The RSI at 61.6 is still neutral, which means the stock is not yet in a classic overbought state. But the Stochastic %K at 82.0 and %D at 63.2 are in overbought territory, suggesting the recent rise has moved faster than the broader trend can comfortably absorb. Stochastic is often more sensitive than RSI, so when it gets stretched first, it can be an early warning that upside may need a pause.
The more important signal is from MACD: MACD 3.411 is still positive, but it sits below the signal line at 3.485, leaving a histogram of -0.074. That negative histogram means momentum is weakening even while price remains elevated. In practical terms, the stock is still in an uptrend, but the engine is not accelerating — it is beginning to lose some thrust. That combination often appears when a rally is maturing rather than just starting.
RSI is neutral, Stochastic is overbought, and MACD is negative.
Volatility & Volume
Volatility is elevated. The Bollinger band width is 20.2% and the ATR is 4.85, equal to 3.8% of price. ATR, or average true range, is a measure of typical daily movement; a higher reading means wider swings are normal and stops can be tested quickly. The expanding band width reinforces that this is not a quiet consolidation — the market is moving with force, but not necessarily with stability.
Volume adds a subtle caution. The latest turnover was 120,433,806, about 1.4× the 20-day average of 87,021,904, so participation was clearly above normal. Usually, that supports the credibility of a price move. But OBV is falling, and that matters because OBV, or on-balance volume, is designed to track whether volume is flowing into the stock or quietly leaving it. Rising price with falling OBV can suggest that the advance is not being broadly confirmed by accumulation. In other words, the market is trading actively, but the volume footprint is not fully matching the upward price action.
Key Levels & Scenarios
The nearest important line in the sand is support at HKD 110.00. That level sits well below the current price, but it is the key floor from the 20-day range and also close enough to matter if momentum fades. Below that, the Bollinger middle band at HKD 119.88 and the SMA20 at HKD 119.88 become the first technical pivot; if price slips back under that area, it would suggest the market is losing short-term trend support and reverting toward the middle of its range.
On the upside, resistance at HKD 128.10 is the immediate barrier, with the upper Bollinger band at HKD 132.00 as the next technical ceiling. A sustained move through resistance would improve the signal quality because it would show that price is not only stretched, but actually converting that stretch into a higher range. If price fails at resistance while MACD remains below signal, the chart would look more like exhaustion than continuation. The 3-month high at HKD 135.50 is the broader reference point above that, while the 3-month low at HKD 88.65 marks the long way down if the trend breaks.
Technical Verdict: HOLD (wait & see)
HOLD (wait & see)
- Reason 1: The trend remains constructive because price is above SMA20 and SMA50, with the SMA20 slope still rising.
- Reason 2: Momentum is not fully aligned: Stochastic is overbought and MACD is below its signal line, which warns that upside momentum is softening.
- Reason 3: Price is pressing resistance at HKD 128.10 while OBV is falling, so the move has participation but not full volume confirmation.
- Verdict invalidated if price breaks below HKD 110.00.
- Ideal Entry Range: HKD 119.88 to HKD 110.00
- Exit Target: HKD 128.10 to HKD 132.00
- Stop Loss Protection: Below HKD 110.00
For non-traders: the chart still leans positive, but the stock is close to resistance and momentum is cooling, so the technical picture is better described as a pause-and-prove setup than a clean breakout.
Summary Data Alibaba
| Last price | 126.70 HKD |
| Change 1 day / 5 days / 1 month | 3.68% / 0.24% / 8.29% |
| Trend / MA-cross | uptrend / none |
| SMA20 / SMA50 | 119.88 / 111.37 |
| RSI (14) / Stochastic %K | 61.6 / 82.0 |
| Bollinger %B / ATR | 78% / 4.85 |
| Support / Resistance 20 days | 110.00 / 128.10 |
| Data as of | 18 Agustus 2026 08:30 WIB |


