DBS Stock Gains 0.25%, Momentum Weakens In Focus
On Agustus 19, 2026: price 75.72 SGD, trend uptrend, RSI 67.0, support 71.90, resistance 76.99. technical analysis of dbs stock. DBS Stock Gains — full details…

DBS Group’s shares were last at SGD 75.72, up 0.25% from the previous close, but the more important signal is where the stock sits inside its recent range: 75% of the way toward the 20-hour resistance at 76.99, while still holding above the SMA20 at 74.64. That combination says the Singapore lender remains in an uptrend, yet the tape is no longer moving in a straight line. Momentum is still positive enough to keep the trend alive, but the indicators are starting to show the kind of hesitation that often appears before a pause, a breakout, or a failed push.
Trend & Price Action
The broad structure is constructive. DBS is trading above both the SMA20 at 74.64 and the SMA50 at 69.94, which means the short-term price is still above its medium-term base and the longer trend remains intact. The SMA20 slope of 1.46% over 5 days signals that the recent lift is still rising rather than flattening out. There is no fresh MA-cross, so the chart is not flashing a new trend shift; instead, it is showing an established advance that is being tested near the upper end of its band. The stock is also close to its 3-month high of 77.97, which matters because markets often become more sensitive near prior peaks: buyers see proof of strength, while sellers look for a stall.
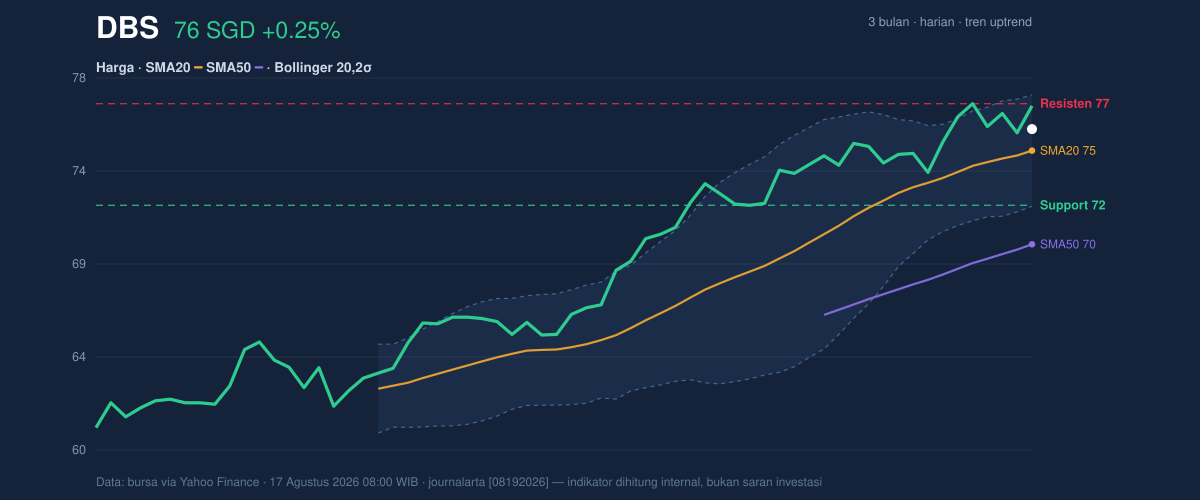
The price action also has a subtle warning embedded in it. DBS rose 1 day 0.25% but slipped 5 days -0.80% even as it gained 1 month 5.23%. That mix usually means the bigger trend is still up, but recent trading has become less decisive. In plain English: the stock is not breaking down, yet it is also not accelerating with conviction.
Oscillators & Momentum
The momentum tools are mixed rather than aligned. RSI at 67.0 is described as neutral, but it sits close to the upper zone where rallies can become stretched. That is not a sell signal by itself; it is a sign that the stock has already done a fair amount of work and may need fresh demand to keep climbing. The Stochastic %K at 76.4 and %D at 65.6 also reads neutral, but with %K above %D, short-term momentum is still leaning upward. The catch is the MACD at 1.802 versus signal at 1.903, with a histogram of -0.101: that negative spread means the underlying pace of the move has softened even though price has not yet cracked. In market terms, the trend is still up, but the push is losing some force.
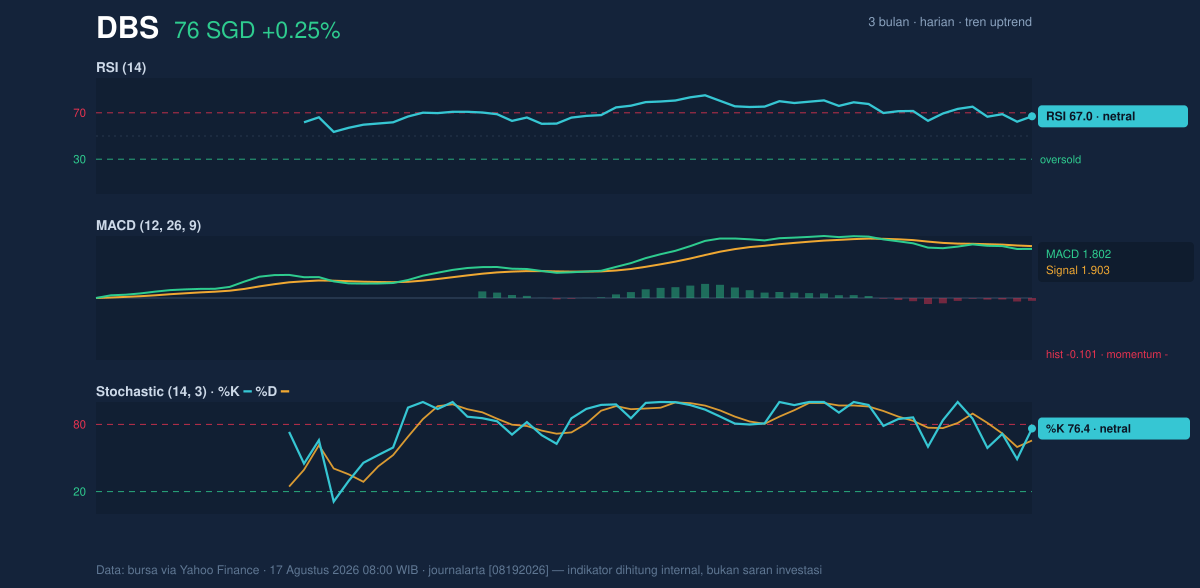
This is where the chart matters most. When price stays firm while MACD turns slightly negative, it often points to consolidation rather than immediate reversal. The signal is not dramatic enough to call a break in trend, but it does suggest the next move may need confirmation from volume or a clean push through resistance.
Volatility & Volume
Volatility is moderate, not explosive. ATR at 1.33, or 1.8% of price, indicates that daily swings are present but still manageable. More interesting is the Bollinger setup: the upper band is 77.43, the middle band is 74.64, and the lower band is 71.85, with %B at 69%. That places DBS above the midpoint of the band range, but not yet pressing the top edge. The 7.5% band width is relatively tight and is described as a squeeze, which often precedes a larger move. A squeeze does not tell direction on its own; it tells you the stock has been coiling, and coiled markets tend to resolve in a sharper burst once pressure is released.
Volume, however, is not confirming urgency. Last trade volume was 3,101,500 versus a 20-hour average of 4,942,535, or only 0.6x normal. That means the recent move has occurred on lighter participation than usual. The encouraging counterpoint is that OBV is rising, which suggests accumulation has not disappeared even if the latest session lacked force. Put together, the message is cautious: the stock is being supported, but not yet chased.
Key Levels & Scenarios
The nearest important floor is support at 71.90. Below that, the chart would begin to lose the short-term structure that has kept the uptrend intact. On the upside, resistance at 76.99 sits just below the 3-month high of 77.97, making this a crowded zone where the market has to prove it can absorb supply. The stock is already trading near the upper half of its Bollinger envelope, so a move through resistance would likely need stronger volume to avoid becoming a false breakout. If it fails to hold the SMA20 at 74.64, the tone would shift from constructive to cautious much faster than the headline price alone suggests.
Technical Verdict: HOLD (wait & see)
HOLD (wait & see) because the trend remains positive above the SMA20 and SMA50, OBV is rising, and the Bollinger setup is in a squeeze that can precede expansion. But the MACD histogram is negative, volume is only 0.6x normal, and price is already approaching resistance at 76.99, so confirmation is still missing.
- Ideal Entry Range: 74.64 to 71.90, where the SMA20 and support line may act as a base.
- Exit Target: 76.99 to 77.43, using the resistance and upper Bollinger band as the first test area.
- Stop Loss protection: below 71.90, because a break there would weaken the current structure.
The verdict is invalidated if price falls below 71.90, because that would mean the recent uptrend is no longer being defended. For non-traders, this means DBS still looks firm, but it needs stronger proof before the next leg higher can be trusted.
“The stock is close to the ceiling, and the next move will matter more than the last one.”
Summary Data DBS
| Last price | 75.72 SGD |
| Change 1 day / 5 days / 1 month | 0.25% / -0.80% / 5.23% |
| Trend / MA-cross | uptrend / none |
| SMA20 / SMA50 | 74.64 / 69.94 |
| RSI (14) / Stochastic %K | 67.0 / 76.4 |
| Bollinger %B / ATR | 69% / 1.33 |
| Support / Resistance 20 days | 71.90 / 76.99 |
| Data as of | 17 Agustus 2026 08:00 WIB |


