Testing Support Level, HSBC Stock Drops 0.86% Today
On Agustus 19, 2026: price 1,514.60 GBp, trend sideways, RSI 53.7, support 1,509.40, resistance 1,597.40. technical analysis of hsbc stock.

HSBC Holdings’ LSE shares fell to 1,514.60 GBp by 17 August 2026 at 14:00 WIB, slipping 0.86% on the day and leaving the stock just above a near-term support line while still below its short-term average. The message from the tape is not dramatic, but it is meaningful: price is trading below the SMA20 at 1,542.83 and above the SMA50 at 1,476.92, which keeps the chart in a sideways-to-cautious zone rather than a clean trend. As shown in the chart, HSBC is now sitting in the lower part of its recent band, where small changes in demand can matter more than the headline move itself.
Trend & Price Action
The stock’s broader structure remains sideways, with the SMA20 rising only 0.69% over five days — a mild upward slope, but not enough to call a decisive uptrend. That matters because a rising short average usually shows short-term buyers are still active; here, the stock is under that line, which suggests momentum has softened before it has fully broken down. The lack of a new MA-cross also tells the same story: there is no fresh moving-average signal forcing a trend call either way.
The current price is also positioned near the lower end of the 20-hour range, with support at 1,509.40 and resistance at 1,597.40. That places HSBC roughly in the bottom slice of its short-term band, which often signals indecision rather than conviction. In plain terms, the market is waiting for a catalyst.
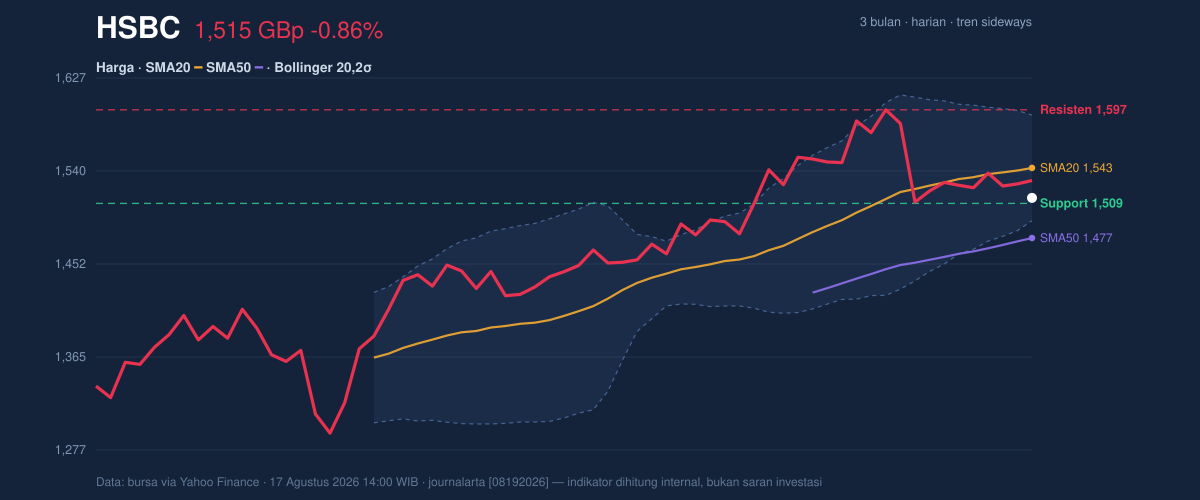
A useful longer view is the 3-month range: 1,267.20 to 1,610.00. HSBC is closer to the upper half of that range than the lower half, which helps explain why the stock can look technically stable even while short-term momentum cools.
Oscillators & Momentum
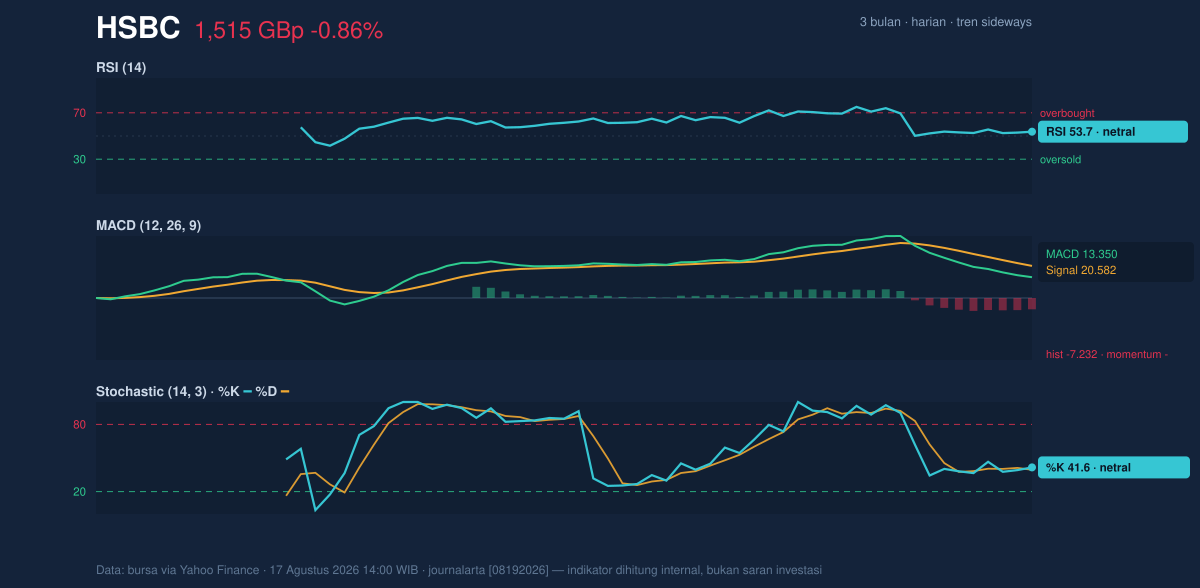
The oscillator set is mixed, and that is the key read. RSI at 53.7 is neutral, meaning the stock is neither overbought nor oversold. Stochastic %K at 41.6 and %D at 39.5 are also neutral, but they sit below the midpoint, which often reflects fading upward energy rather than outright weakness. The more important warning comes from MACD: MACD 13.350 is below the signal line at 20.582, with a histogram of -7.232. That negative histogram shows downside momentum is currently stronger than the underlying trend line, even if the broader chart has not yet rolled over.
This is the sort of setup that can precede a pause or a pullback: price is not collapsing, but momentum is no longer confirming the earlier recovery. As shown in the chart, the oscillators are not screaming panic — they are quietly losing traction.
Volatility & Volume
The Bollinger Bands add another layer of nuance. HSBC is trading below the middle band at 1,542.83 and not far above the lower band at 1,493.11, with %B at 22%. That reading means the price is hugging the lower part of its recent volatility envelope, which often signals a market leaning defensive. At the same time, the band width is only 6.4% and is narrowing, a classic squeeze pattern. A squeeze does not predict direction by itself; it says volatility is compressed and a larger move may be building.
ATR(14) at 33.96, or 2.2% of price, confirms volatility is moderate rather than extreme. So the chart is not unstable — it is compressed. That makes the next meaningful move more important than the last one.
Volume, however, is not helping the bulls yet. The latest turnover of 11,086,954 shares is only 0.4× the 20-day average of 28,553,671, which suggests participation is thin. Thin volume on a weak day can mean sellers are not pressing hard; equally, it can mean buyers are absent. The encouraging detail is that OBV is rising, which implies the cumulative flow of volume has been constructive even while the latest session was quiet. That divergence can matter: it hints that longer-horizon accumulation may still be present under the surface.
Key Levels & Scenarios
The immediate line in the sand is 1,509.40. If HSBC holds above that support, the stock can keep trading inside its current range and potentially retest the 1,542.83 middle band, then the 1,597.40 resistance zone. A move through that resistance would be more convincing if accompanied by stronger volume, because the current session’s turnover is too light to confirm a breakout on its own.
If price fails to hold 1,509.40, the lower Bollinger band at 1,493.11 becomes the next technical reference, and the 1,476.92 SMA50 then matters as the next major support marker. That would shift the chart from “range-bound with compression” to “range breakdown with trend risk.”
The core signal is a compressed chart with neutral oscillators, but MACD weakness and sub-average volume argue that HSBC needs confirmation before the next move can be trusted.
Technical Verdict: HOLD (wait & see)
HOLD (wait & see)
- Reason 1: MACD is negative — the 13.350 MACD line sits below the 20.582 signal line, and the -7.232 histogram shows momentum is still soft.
- Reason 2: Price is below the SMA20 at 1,542.83, which means short-term price action has not yet regained the average that often acts as a trend filter.
- Reason 3: Bollinger Bands are squeezing with width at 6.4%, so the stock is compressed and waiting for direction rather than already trending.
- Verdict invalidated if price falls below 1,493.11 on the Bollinger lower band, because that would suggest the current range is breaking down rather than merely pausing.
- Ideal Entry Range: 1,509.40 to 1,542.83
- Exit Target (Target Price): 1,597.40
- Stop Loss protection: 1,493.11
For non-traders: HSBC is not flashing a clear trend signal yet, but it is close enough to support and compression that the next move could matter more than the last few sessions.
The stock’s 3-month high stands at 1,610.00.
Summary Data HSBC
| Last price | 1,514.60 GBp |
| Change 1 day / 5 days / 1 month | -0.86% / -0.77% / 2.28% |
| Trend / MA-cross | sideways / none |
| SMA20 / SMA50 | 1,542.83 / 1,476.92 |
| RSI (14) / Stochastic %K | 53.7 / 41.6 |
| Bollinger %B / ATR | 22% / 33.96 |
| Support / Resistance 20 days | 1,509.40 / 1,597.40 |
| Data as of | 17 Agustus 2026 14:00 WIB |
Track HSBC share price daily: live levels, support/resistance and our full HSBC analysis history.


