HSBC Stock Technicals Today: Drops 2.21%, Testing Support Level
On Agustus 20, 2026: price 1,497.20 GBp, trend sideways, RSI 49.2, support 1,510.60, resistance 1,597.40. technical analysis of hsbc stock.

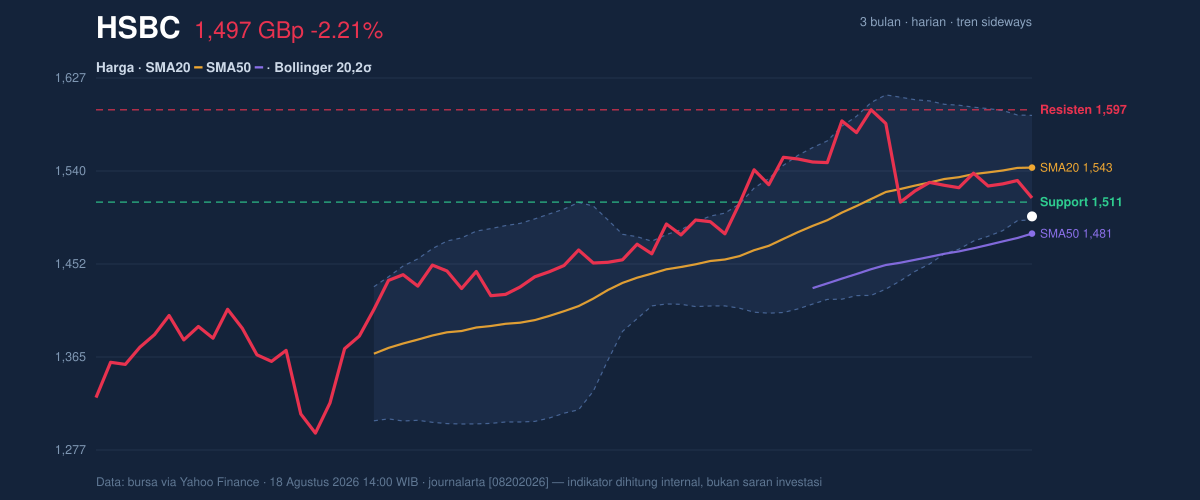
HSBC Holdings’ 1,497.20 GBp close on 18 August 2026 leaves the shares just below the 1,494.02 lower Bollinger Band and under the 1,543.09 20-day average, a combination that says the stock is not in a clean uptrend even though the broader setup remains sideways. The immediate message from the chart is not panic, but pressure: price has slipped -2.21% in one day, is down -1.77% over five days, and sits well below the short-term midpoint of its range. That matters because in technical terms, a stock below its near-term average but still above its 1,480.98 50-day average is often in a transitional phase — neither fully broken nor clearly recovering.
Trend & Price Action
As shown in the chart, HSBC is trading below the SMA20 but above the SMA50, which usually signals that the immediate trend has weakened while the medium-term structure has not yet turned decisively bearish. The absence of a new MA-cross means there is no fresh moving-average confirmation either way. That lack of crossover is important: it tells readers the market has not yet chosen a strong direction, even though the latest price action is leaning lower. The sideways trend label, combined with a modest 0.59% SMA20 slope over five days, suggests the average itself is still rising gently, but price has drifted away from it.
The stock is also trading at the lower edge of its recent volatility envelope. With the 20-hour support at 1,510.60 and resistance at 1,597.40, the latest print sits near the bottom of that range, about -15% from the upper end. In plain language, the market is still inside the corridor, but it is leaning toward the floor rather than the ceiling.
Oscillators & Momentum
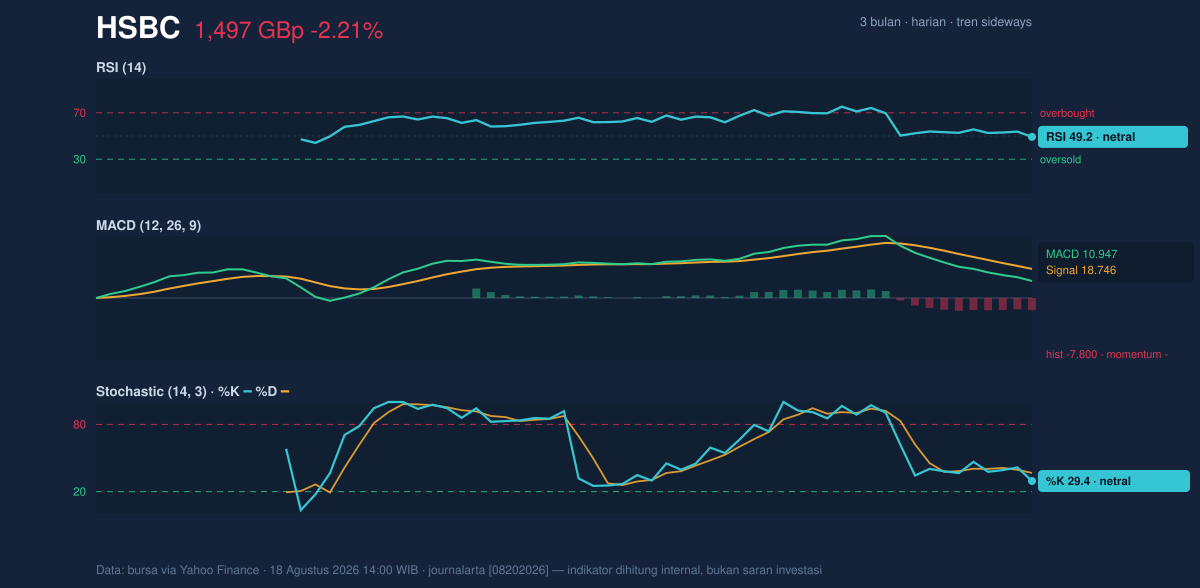
The momentum picture is mixed, and that is the main reason the chart does not yet deliver a clean bullish or bearish signal. The RSI at 49.2 is neutral, meaning the stock is neither stretched upward nor oversold. The Stochastic %K at 29.4 and %D at 36.7 also read as neutral, but they sit in the lower half of the range, which hints that short-term selling pressure has been more persistent than buying interest. The key point is that these oscillators are not yet flashing a reversal; they are simply showing a market that has cooled.
The more telling signal is the MACD. With 10.947 below the 18.746 signal line and a -7.800 histogram, momentum is negative. In practical terms, that means recent price movement has weakened enough that the trend-following indicator is now lagging behind and confirming downside pressure. It does not automatically imply a major downtrend, but it does say the latest price behavior has not been strong enough to regain control from sellers.
Volatility & Volume
The Bollinger setup is one of the more interesting parts of the chart. The bands are relatively tight, with a width of 6.4%, which indicates a squeeze — a period when price compression often precedes a larger move. But the direction of that move is not predetermined. Because price is sitting near the 1,494.02 lower band and the %B is 3%, the stock is effectively hugging the downside edge of its volatility envelope. That usually means the market is testing whether buyers will defend the lower boundary or whether the price will start to slip outside the band.
Volume complicates the picture. Last volume of 17,890,740 was only 0.6× the 20-hour average of 28,728,014, so the latest dip did not come with especially strong participation. That matters because weak volume on a decline often suggests the move is not yet being driven by broad conviction. At the same time, OBV is rising, which implies cumulative buying pressure has not disappeared even if the latest session was soft. In other words, the market is selling off on lighter turnover while the longer volume trend still points to some underlying accumulation.
ATR at 32.63, or about 2.2% of price, shows volatility is present but not extreme. That fits the squeeze message: the stock is compressed, but not inert.
Key Levels & Scenarios
The most important support to watch is 1,494.02, the lower Bollinger Band, followed by the 1,480.98 SMA50. If price holds above those levels, the chart can remain in a sideways consolidation with room to stabilize. If it loses them, the technical tone would weaken quickly because the market would be giving up both the volatility floor and the medium-term average.
On the upside, 1,510.60 is the first recovery checkpoint, because it marks the 20-hour support that price has already slipped beneath. Above that, 1,543.09 — the SMA20 and Bollinger midline — is the more important reclaim level, since it would show the stock has moved back to the center of its range. The next resistance is 1,597.40, and then the 1,610.00 three-month high becomes the ceiling that would need to be challenged for a stronger technical reset.
Technical Verdict: HOLD (wait & see)
HOLD (wait & see) fits best because the chart is caught between conflicting signals: price is below the SMA20, MACD is negative, and the stock is pressing the lower Bollinger Band, but RSI is neutral, OBV is rising, and the share price remains above the SMA50. That combination says downside pressure is real, yet not decisive enough to call a full trend break.
- Entry Range: 1,494.02 to 1,510.60, where the lower Bollinger Band and 20-hour support may act as a stabilization zone.
- Exit Target: 1,543.09 first, then 1,597.40 if price can reclaim the 20-day average and rebuild momentum.
- Stop Loss protection: below 1,480.98, because a break under the SMA50 would weaken the medium-term structure.
The chart is saying HSBC is compressed, not confirmed — and the next decisive move depends on whether 1,494.02 holds or gives way.
Verdict invalidated if price breaks below 1,480.98.
HSBC’s three-month high is 1,610.00 and its three-month low is 1,267.20.
Summary Data HSBC
| Last price | 1,497.20 GBp |
| Change 1 day / 5 days / 1 month | -2.21% / -1.77% / -0.81% |
| Trend / MA-cross | sideways / none |
| SMA20 / SMA50 | 1,543.09 / 1,480.98 |
| RSI (14) / Stochastic %K | 49.2 / 29.4 |
| Bollinger %B / ATR | 3% / 32.63 |
| Support / Resistance 20 days | 1,510.60 / 1,597.40 |
| Data as of | 18 Agustus 2026 14:00 WIB |
Track HSBC share price daily: live levels, support/resistance and our full HSBC analysis history.