AMAT Stock Analysis: Gains 0.01%, Momentum Weakens
On Agustus 21, 2026: price 496.21 USD, trend downtrend, RSI 43.9, support 436.45, resistance 548.15. technical analysis of amat stock. AMAT Stock Analysis —…
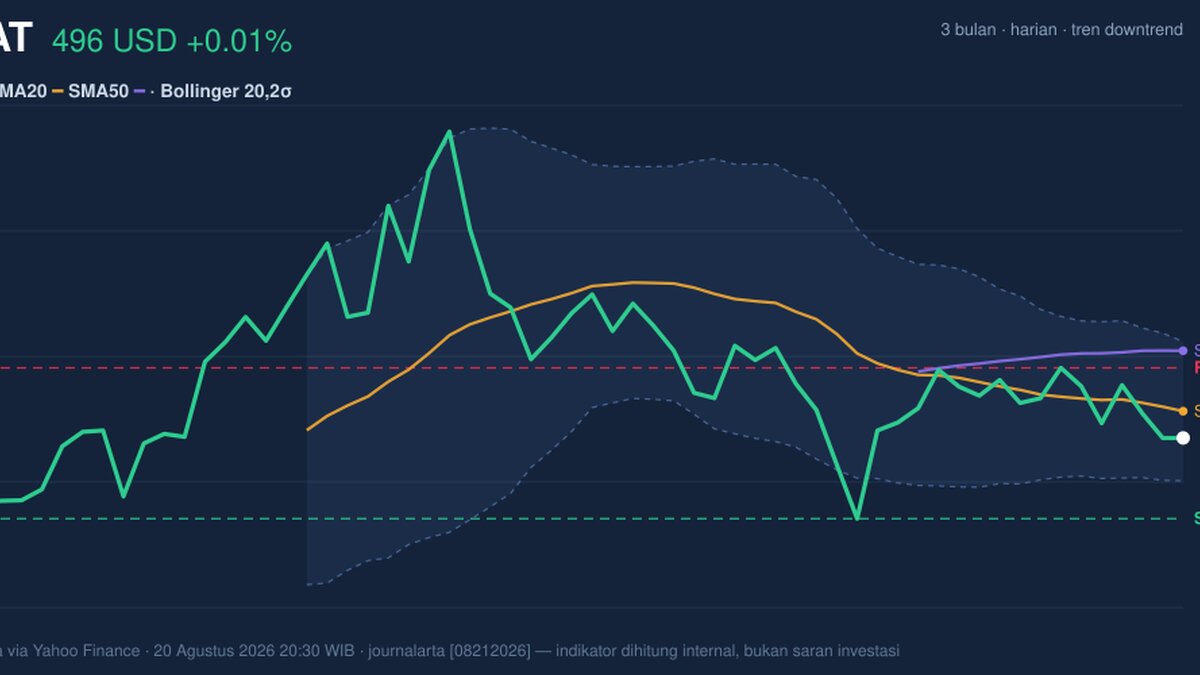
Applied Materials is trading in a market that is still digesting a clear slide from strength: the stock finished at 496.21 USD, barely changed on the day, but it remains down 7.17% over five days and 11.83% over one month, according to Nasdaq-linked Yahoo Finance data cited at 20 August 2026 20:30 WIB. For international readers, the key point is not the flat close; it is that a large semiconductor equipment name is now sitting below its short- and medium-term trend markers, a sign that sellers have had the upper hand for several sessions.
Trend & Price Action
The chart shows a stock that is still in a downtrend, with the SMA20 at 516.04 and the SMA50 at 560.80 both above the current price. That matters because moving averages are often used as a rough measure of whether a stock is being bought on dips or sold into rallies; here, the price being below both averages says the rebound attempts have not yet regained control. The SMA20 slope of -1.78% over 5 days reinforces that the near-term trend is not just weak, but still leaning lower.
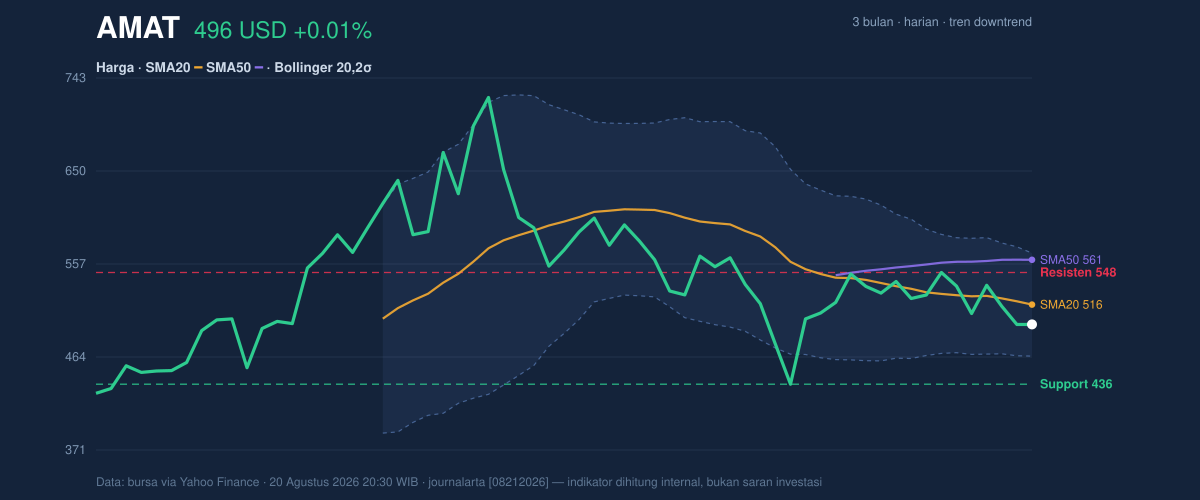
There is also no fresh moving-average crossover to point to a clean trend reversal. In practical terms, that means the market has not produced the kind of technical reset that would normally suggest the decline has fully exhausted itself. The stock is trading at 54% of its 20-hour range, which places it in the lower half of that band but not at the floor. Against the broader backdrop, the shares remain well below the 3-month high of 739.67 and above the 3-month low of 421.61, leaving the price in the lower half of its recent trading window.
Oscillators & Momentum
The momentum picture is mixed, but not in a way that yet favors a durable turn. The RSI at 43.9 is neutral, which means the stock is neither deeply oversold nor showing the kind of strength that typically accompanies a trend recovery. By contrast, the Stochastic %K at 11.5 and %D at 21.7 are in oversold territory, a signal that short-term selling may be stretched. Oversold does not mean a bounce is guaranteed; it means the market may be vulnerable to a relief move if sellers pause.
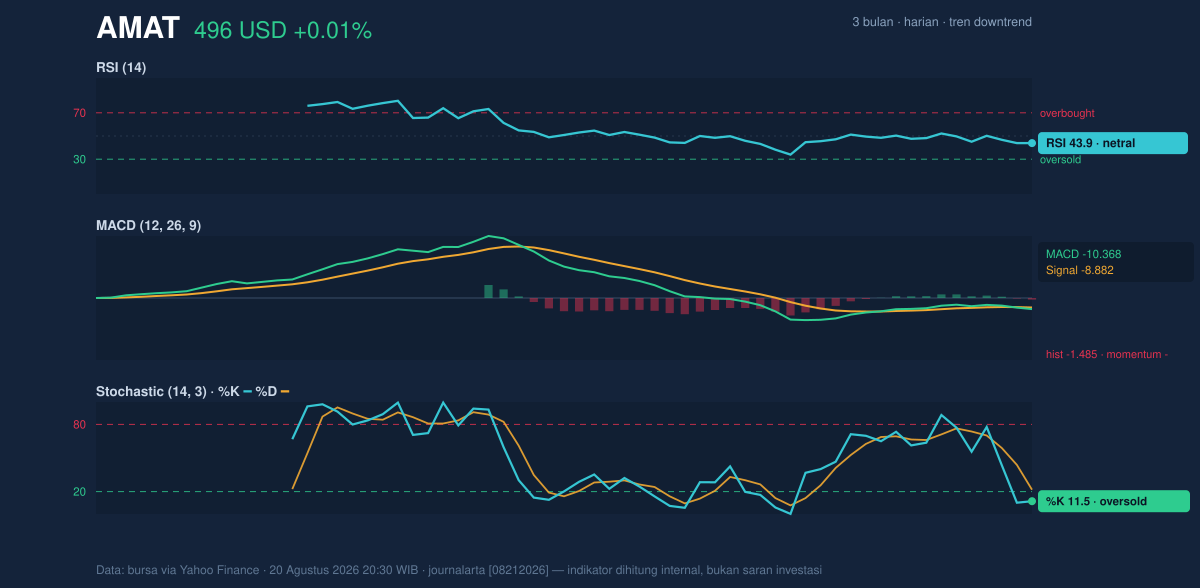
The more important caution comes from the MACD at -10.368, with the signal line at -8.882 and a histogram of -1.485. That configuration shows momentum is still negative, because the MACD line remains below the signal line and the gap is still unfavorable. In plain language, the stock may be oversold in the short run, but its broader impulse is still pointing down. That is why the oscillators do not yet override the trend.
Volatility & Volume
Volatility is elevated, and that can make any move sharper once it starts. The ATR(14) at 27.66, equal to 5.6% of price, indicates a wide daily trading range relative to the share price. Traders often read that as a warning that stop levels can be reached quickly if momentum accelerates. The Bollinger Bands place the upper band at 567.54, the middle band at 516.04, and the lower band at 464.54, with %B at 31% and a 20.0% band width. That combination suggests the stock is trading in the lower portion of its volatility envelope, but the band width is still normal rather than compressed, so this is not a quiet coiling pattern waiting for an obvious breakout.
Volume does not yet confirm that buyers are taking charge. The latest volume was 6,595,500, below the 20-day average of 8,046,650, or about 0.8x normal. Lower-than-average participation during a weak phase often means the market is not seeing aggressive dip-buying. The OBV is falling, which is important because on-balance volume tracks whether money flow is supporting the price. A declining OBV alongside a downtrend usually means rallies are being met with distribution rather than accumulation.
Key Levels & Scenarios
The nearest technical floor to watch is the support at 436.45, while the nearest ceiling is the resistance at 548.15. Between those levels, the stock is still trying to find balance after the recent decline. The Bollinger middle band at 516.04 is especially important because it sits just above the current price and lines up with the short-term trend gauge. If the stock can reclaim that area, it would suggest the recent slide is losing force. If it cannot, the path of least resistance remains lower.
The signal from the chart is straightforward: the shares are not breaking down in a panic, but neither are they showing the volume or momentum needed to claim a recovery. A move back above the middle band would improve the tone; failure to hold the lower part of the range would expose the market to another test of the lower support zone.
Technical Verdict: HOLD (wait & see)
HOLD (wait & see) because the stock is still below SMA20 and SMA50, MACD remains negative, and OBV is falling, even though Stochastic is oversold and the price is near the lower half of its recent range. The setup suggests pressure is still dominant, but short-term exhaustion could produce a rebound.
- Ideal Entry Range: 464.54 to 496.21, using the lower Bollinger band and current price area as the nearest technical zone.
- Exit Target: 516.04 to 548.15, aligned with the Bollinger middle band and 20-hour resistance.
- Stop Loss protection: below 436.45, which is the stated 20-hour support.
- Verdict invalidated if price breaks below 436.45, because that would signal the current range has failed and the downtrend is extending.
For non-traders, this means the stock looks weak, but not weak enough to force a decisive bearish break yet.
Summary Data AMAT
| Last price | 496.21 USD |
| Change 1 day / 5 days / 1 month | 0.01% / -7.17% / -11.83% |
| Trend / MA-cross | downtrend / none |
| SMA20 / SMA50 | 516.04 / 560.80 |
| RSI (14) / Stochastic %K | 43.9 / 11.5 |
| Bollinger %B / ATR | 31% / 27.66 |
| Support / Resistance 20 days | 436.45 / 548.15 |
| Data as of | 20 Agustus 2026 20:30 WIB |
Track AMAT stock price daily: live levels, support/resistance and our full AMAT analysis history.