AMD Stock Analysis: Gains 0.65%, Momentum Weakens
On Agustus 21, 2026: price 469.46 USD, trend downtrend, RSI 44.9, support 429.56, resistance 521.95. technical analysis of amd stock. AMD Stock Analysis — full…
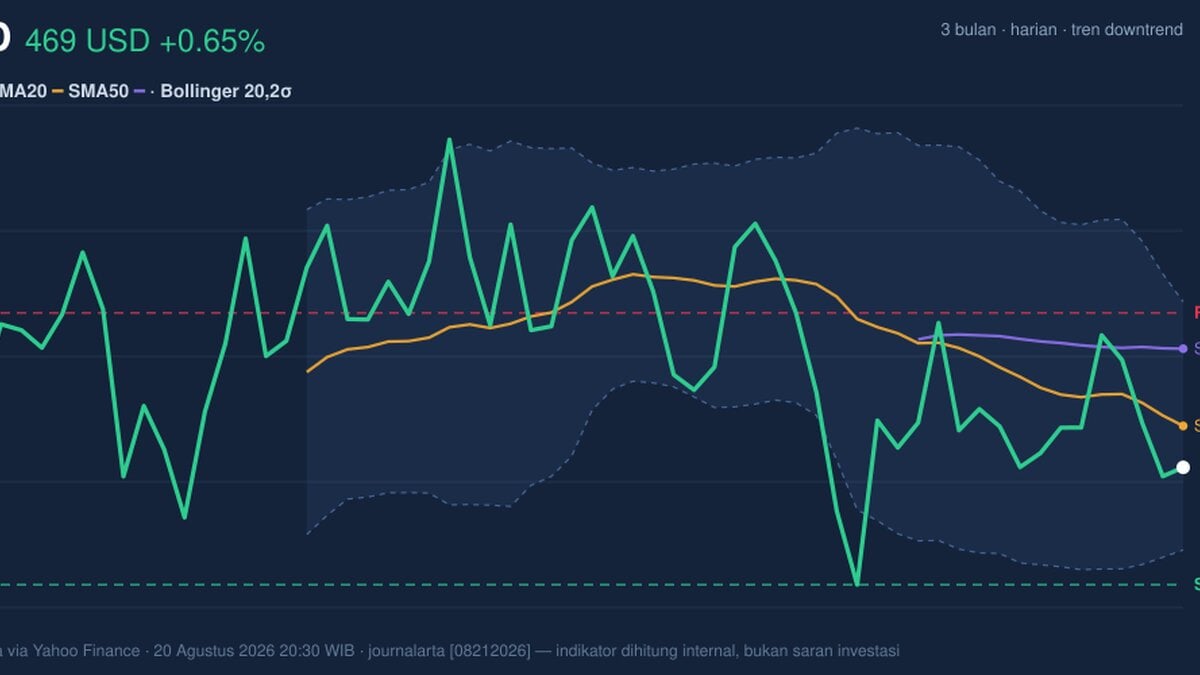
AMD’s latest tape shows a stock that is still under pressure even after a small daily bounce, with the broader message for global investors being that short-term relief has not yet reversed the larger downtrend.
Advanced Micro Devices closed at 469.46 USD, up 0.65% from the previous close of 466.42, but the more important read is the path underneath that move: the shares are down 2.81% over five days and 13.01% over one month, according to exchange data compiled via Yahoo Finance. That matters because a one-day gain can look encouraging, yet it does little if the stock is still trading below its short-term trend line and drifting through a weaker phase of price discovery.
Trend & Price Action
The chart shows AMD sitting below both its SMA20 at 483.55 and SMA50 at 509.82, a setup that usually signals that recent buyers are still losing ground to sellers. The downtrend is reinforced by the SMA20 slope of -1.98% over five days, which means the short-term average itself is pointing lower rather than flattening out. In plain language, the market is not just below trend; the trend is still moving away from the share price.
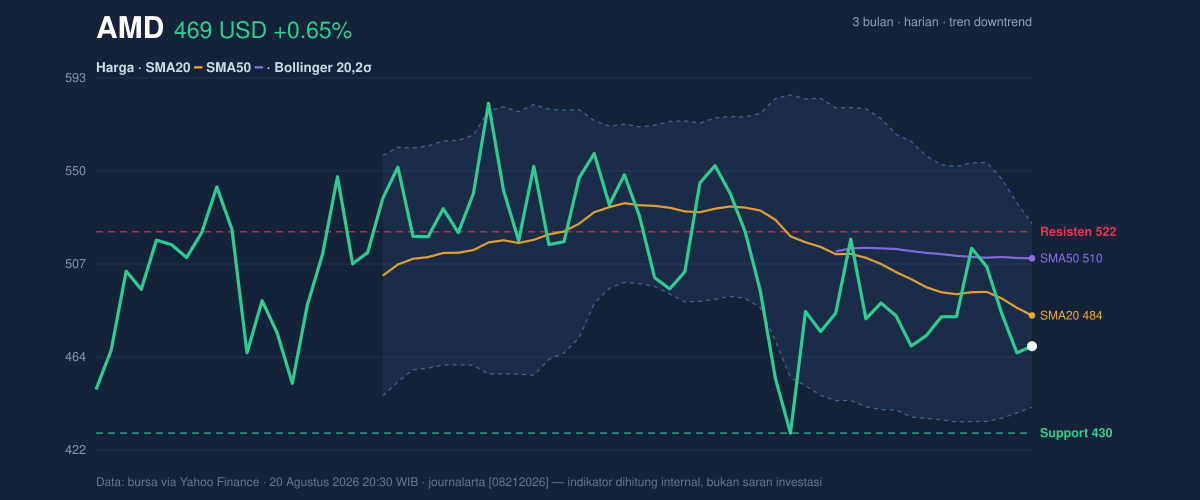
The broader range also tells a cautious story. AMD is trading at 43% of its 20-hour range, between support at 429.56 and resistance at 521.95. That positioning says the stock is closer to the lower half of its recent band than the upper half, which is consistent with a market that has not yet regained control. The three-month high and low, 584.73 and 424.03, frame the same message: the stock has already moved well off the top of its recent range, but it has not fully tested the lower boundary either.
The Bollinger Bands add nuance. With the middle band at 483.55 and the lower band at 441.34, AMD is currently below the midline but above the lower edge, while %B at 33% shows price sitting in the lower third of the band structure. That is not an extreme selloff signal, but it does indicate the stock is still leaning weak rather than neutral. The band width of 17.5% is described as normal, so this is not yet a volatility squeeze that often precedes a sharp breakout. Instead, the market looks compressed enough to keep direction important, but not so tight that a major move is clearly imminent.
Oscillators & Momentum
Momentum is mixed, and that mix is the key to reading AMD correctly. The RSI at 44.9 is neutral, which means the stock is neither stretched upward nor washed out. That alone would suggest balance, but the Stochastic %K at 18.9 and %D at 24.2 sit in oversold territory, implying the recent decline has gone far enough to attract short-term bargain hunting. The catch is that oversold does not mean recovered; it only means downside pressure may be getting tired.
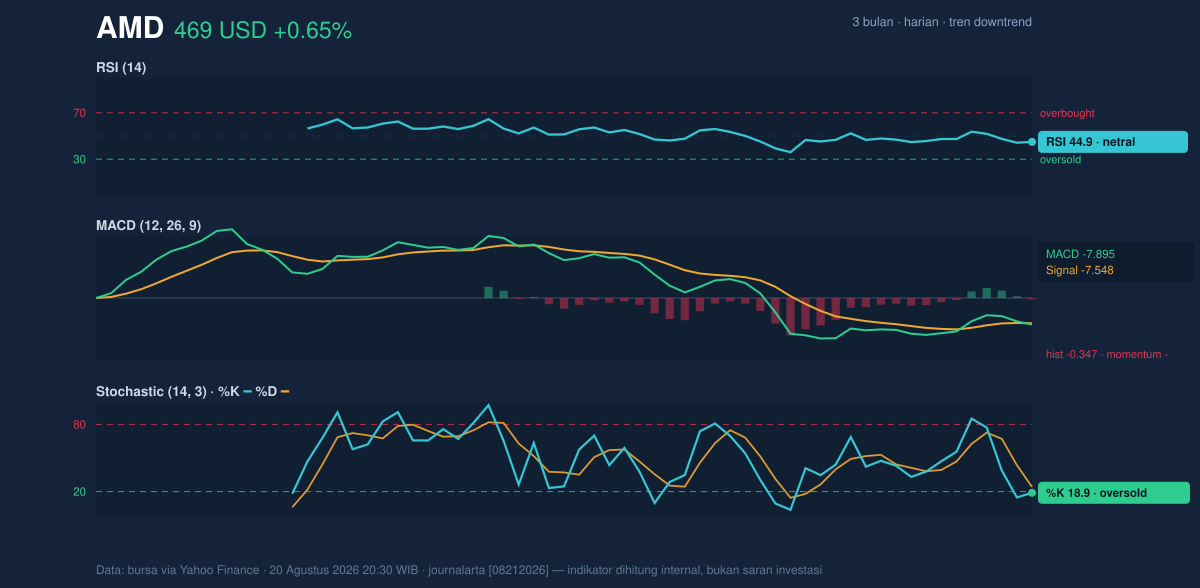
The MACD at -7.895, below its signal line at -7.548 with a histogram of -0.347, keeps the momentum signal negative. This is important because MACD is often used to gauge whether a move is gaining or losing force. Here, the indicator says downside momentum still has the upper hand, even if it is not accelerating aggressively. Put differently, AMD is not in free fall, but the trend has not yet turned.
Volatility & Volume
Volatility remains a meaningful factor. The ATR at 24.86, equal to 5.3% of price, indicates relatively high daily movement potential. For readers outside trading circles, ATR measures how much a stock typically moves in a day; a higher reading means wider swings and less certainty from one session to the next. That matters here because a stock with elevated ATR can rebound quickly, but it can also break support just as fast.
Volume does not yet confirm a strong reversal. The latest volume of 15,146,700 is well below the 20-day average of 27,188,815, or about 0.6x, which suggests participation was light. When volume is thin during a bounce, rallies can be fragile because fewer market participants are committing capital behind the move. The OBV is falling, reinforcing that message: the stock’s price may have stabilized for a day, but underlying accumulation has not clearly returned.
Key Levels & Scenarios
The market is now balancing between a nearby support floor and a more meaningful overhead barrier. The first level to watch is support at 429.56, just above the 3-month low of 424.03. If that floor gives way, the chart would likely signal that the recent decline still has unfinished business. On the upside, resistance at 521.95 sits above the SMA20 at 483.55, so AMD would need to reclaim both short-term trend and range resistance before the tone improves materially.
The most useful reading is conditional: if price can climb back above the SMA20 at 483.55 and hold there with better volume, the market would be showing the first real sign that the downtrend is easing. If it fails to do that and instead loses 429.56, the chart would be telling a different story, one in which the recent bounce was only a pause inside a larger decline.
Technical Verdict: HOLD (wait & see)
HOLD (wait & see) is the clearest technical call from the current data because the stock is still below its short-term and medium-term moving averages, while momentum remains negative even as some oscillators approach oversold territory.
- Reason 1: Price is below the SMA20 at 483.55 and SMA50 at 509.82, which keeps the trend tilted lower.
- Reason 2: MACD is negative at -7.895 and below its signal line, showing downside momentum is still active.
- Reason 3: Stochastic is oversold at 18.9 / 24.2, which can support a rebound, but volume at 0.6x average and falling OBV do not yet confirm it.
- Verdict invalidated if price breaks below 429.56, because that would threaten the current support base and reopen the lower end of the recent range.
- Ideal entry range: 429.56 to 441.34
- Exit target: 483.55 to 521.95
- Stop loss protection: below 424.03
For non-traders: AMD is showing signs of exhaustion on the downside, but not enough proof yet that the slide has ended.
“Right now the chart is asking for patience, because the next decisive move could be the one that tells whether this is a pause — or another leg lower.”
Summary Data AMD
| Last price | 469.46 USD |
| Change 1 day / 5 days / 1 month | 0.65% / -2.81% / -13.01% |
| Trend / MA-cross | downtrend / none |
| SMA20 / SMA50 | 483.55 / 509.82 |
| RSI (14) / Stochastic %K | 44.9 / 18.9 |
| Bollinger %B / ATR | 33% / 24.86 |
| Support / Resistance 20 days | 429.56 / 521.95 |
| Data as of | 20 Agustus 2026 20:30 WIB |
Track AMD stock price daily: live levels, support/resistance and our full AMD analysis history.