DIS Stock Gains 0.36% Today, Testing Key Resistance
On Agustus 21, 2026: price 107.32 USD, trend uptrend, RSI 64.3, support 94.85, resistance 107.32. technical analysis of dis stock. DIS Stock Gains — full…
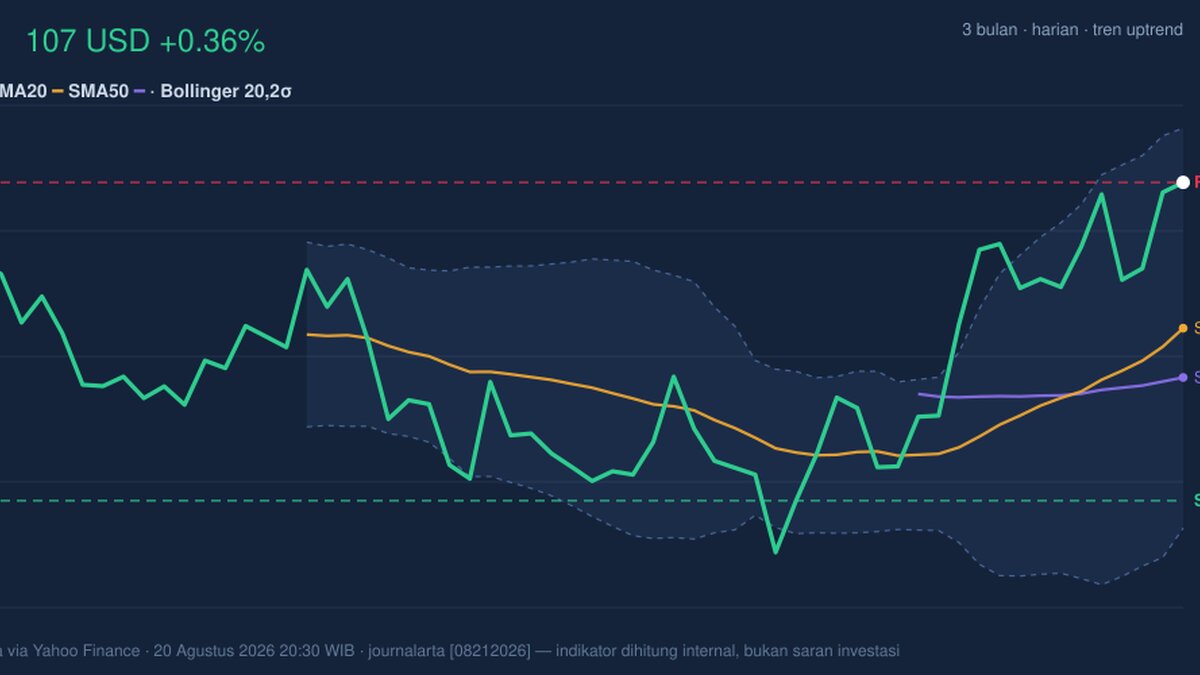
107.32 USD is where Walt Disney’s shares stood on 20 August 2026 at 20:30 WIB, up 0.36% on the day and 15.61% over the past month, according to Yahoo Finance data from the NYSE feed. That combination matters more than the headline gain alone: the stock is trading above both its short- and medium-term moving averages, but it is also sitting at the top of its recent range, where momentum can either extend or stall. The chart shows a market that has improved decisively, yet is now testing the ceiling of that improvement.
Trend & Price Action
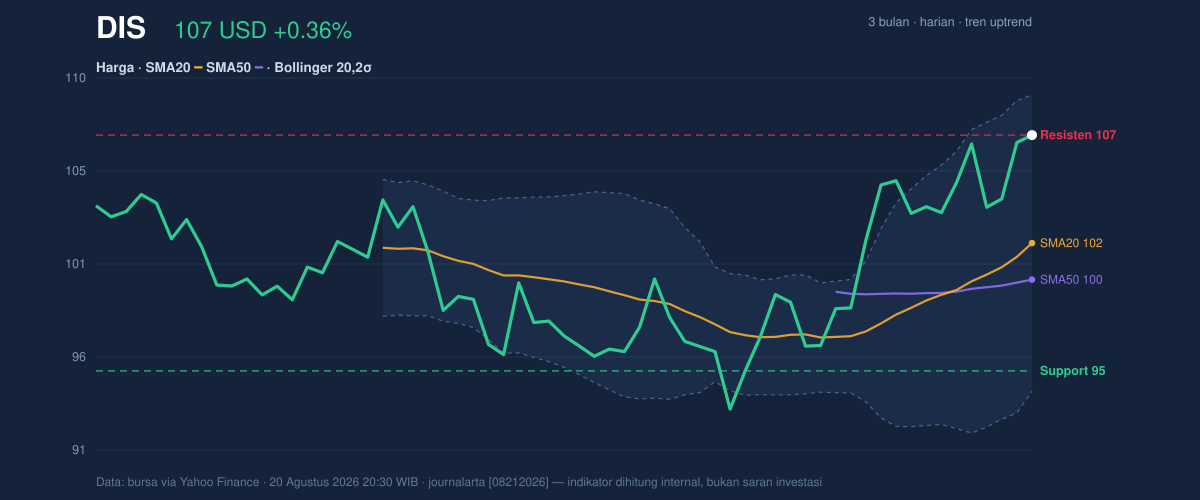
Disney’s 107.32 USD close is above the SMA20 at 101.61 and the SMA50 at 99.68, which keeps the broader structure in uptrend territory. The SMA20 slope of 2.50% over 5 days signals that the short-term trend is still rising rather than flattening out. In plain terms, buyers have been willing to pay progressively higher prices, and that usually means the market is rewarding the company’s latest narrative rather than just reacting to a one-day move.
But the positioning is tight. The stock is at 100% of its 20-hour range, with 20-hour support at 94.85 and 20-hour resistance at 107.32, effectively the current price itself. The 3-month high of 108.69 sits just above, which makes this zone important: the shares are not merely rising, they are pressing into an area where previous advances have already encountered supply.
That is the difference between a healthy trend and an easy one. Here, the trend is healthy, but not easy.
Oscillators & Momentum
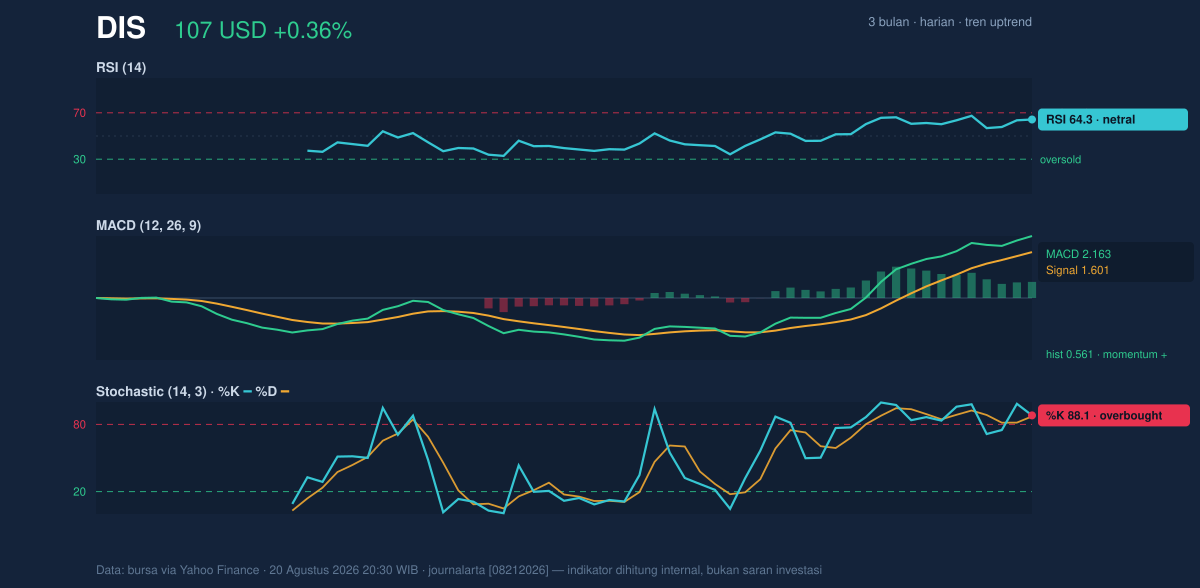
The momentum picture is mixed in a way that often appears near short-term inflection points. RSI at 64.3 is still described as neutral, which tells readers the stock is not yet in a classic exhaustion zone. However, Stochastic %K at 88.1 and %D at 87.2 are both in overbought territory, meaning the recent rally has moved fast enough that the shares may need consolidation before another leg higher can develop. Overbought does not mean “about to fall” on its own; it means the pace of buying has been strong enough that the market is vulnerable to pauses.
The MACD at 2.163, above its signal line at 1.601, with a 0.561 histogram, still confirms positive momentum. In practical terms, MACD is showing that the trend is not just drifting upward; it has enough internal force to keep pushing. The key nuance is that momentum tools are no longer perfectly aligned: MACD supports the trend, while Stochastic warns that the move has become stretched in the short run. That split often leads to either a brief pullback or a sideways pause rather than an immediate trend break.
Volatility & Volume
The Bollinger upper band at 109.44, with the middle band at 101.61 and lower band at 93.77, frames the current move neatly. With %B at 86%, Disney is trading close to the upper band, which usually means price is leaning into the upper end of its recent statistical envelope. The 15.4% band width is described as normal, so this is not a volatility breakout regime; it is a steady trend within ordinary price dispersion. That matters because normal band width tends to favor controlled movement rather than explosive gaps.
Volume tempers the enthusiasm. Last trade volume of 7,969,900 was only 0.7x normal versus the 20-session average of 10,939,180. In other words, the stock is advancing without full participation. That is not a bearish signal by itself, but it does mean the latest push is not yet backed by unusually strong turnover. The rising OBV helps offset that concern, because on-balance volume suggests money flow has still been net positive beneath the surface. Put simply: the rally has support, but not broad conviction at this exact moment.
Key Levels & Scenarios
The immediate technical map is compact. 107.32 USD is the current pivot, while 108.69 is the nearby 3-month high and 109.44 marks the Bollinger upper band. On the downside, 101.61 is both the SMA20 and Bollinger midline, making it the first meaningful line of defense if the stock loses altitude. Below that, 99.68 is the SMA50, and 94.85 is the 20-hour support level that would signal a deeper repair in the trend.
If Disney clears the 108.69 high and stays above it, the chart would show that buyers have absorbed the recent overhead supply. If it fails to hold above 101.61, the move would look less like a breakout attempt and more like a stretched rally needing a reset. The current setup is therefore less about direction and more about whether momentum can survive at the top of the range.
Technical Verdict: HOLD (wait & see)
HOLD (wait & see)
- MACD remains positive, confirming the broader uptrend is still intact.
- Stochastic is overbought, which raises the odds of a pause or pullback after a sharp month-long advance.
- Price is near the 3-month high and Bollinger upper band, so upside continuation would need fresh confirmation rather than assumption.
Verdict invalidated if price falls below 101.61, where the SMA20 and Bollinger midline sit together.
- Ideal Entry Range: 101.61 to 99.68
- Exit Target: 108.69 to 109.44
- Stop Loss protection: 94.85
For non-traders: Disney’s chart is still constructive, but it is stretched enough that the next move matters more than the last one.
“The market is asking whether this rally has another chapter, or whether it needs to breathe first.”
Summary Data DIS
| Last price | 107.32 USD |
| Change 1 day / 5 days / 1 month | 0.36% / 2.40% / 15.61% |
| Trend / MA-cross | uptrend / none |
| SMA20 / SMA50 | 101.61 / 99.68 |
| RSI (14) / Stochastic %K | 64.3 / 88.1 |
| Bollinger %B / ATR | 86% / 2.37 |
| Support / Resistance 20 days | 94.85 / 107.32 |
| Data as of | 20 Agustus 2026 20:30 WIB |
Track DIS stock price daily: live levels, support/resistance and our full DIS analysis history.