On Oktober 6, 2026: price 77.90 USD, trend downtrend, RSI 43.8, support 75.38, resistance 80.35. technical analysis of pdd stock. Momentum Gains — full details…
By matthew jonathan
October 6, 20264 min read
Momentum Gains, PDD Stock Gains 3.34% Today
PDD Holdings shares rose 3.34% to $77.90 on 6 October, but the daily rebound has not yet reversed a broader decline. For international investors, the tension is familiar: a sharp one-day gain can attract attention, while the underlying trend and trading volume show whether buyers have regained control.
Trend & Price Action
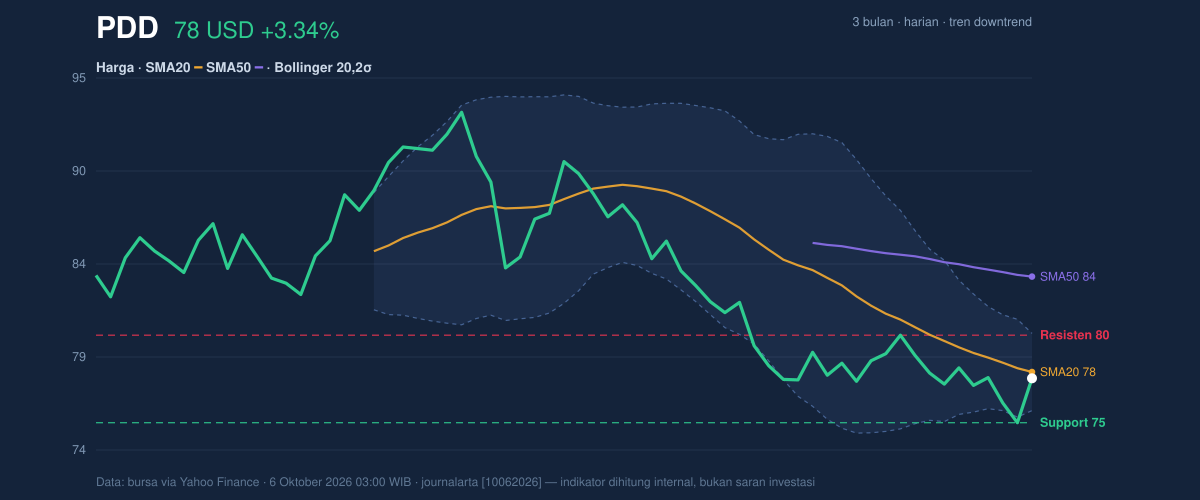
The stock remains below both its 20-day simple moving average, at $78.26, and its 50-day average, at $83.68. A simple moving average tracks the average closing price over a set period; trading below both suggests recent selling pressure still outweighs the latest bounce. The 20-day average is also sloping down, falling 1.76% over five days. There has been no recent crossover between the averages to signal a change in trend.
PDD has gained 3.34% in the latest session, yet is down 0.75% over five days and 5.24% over a month. Its three-month range runs from $74.72 to $93.19, placing the current price well below the period’s high and closer to its low. That context makes the session’s advance a recovery attempt, not confirmation of a durable turn.
The Bollinger Bands, which frame price movement around a moving average, extend from $76.07 to $80.45. PDD’s position at 42% of the band’s width leaves it below the midpoint and short of the upper boundary. The bands are narrowing, a squeeze that indicates subdued recent price variation and can precede a larger move, though it does not show which direction that move will take.
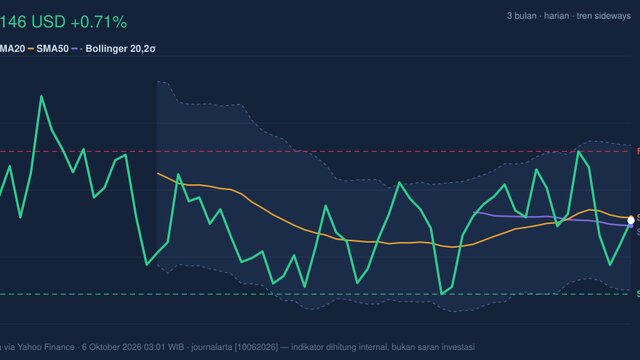
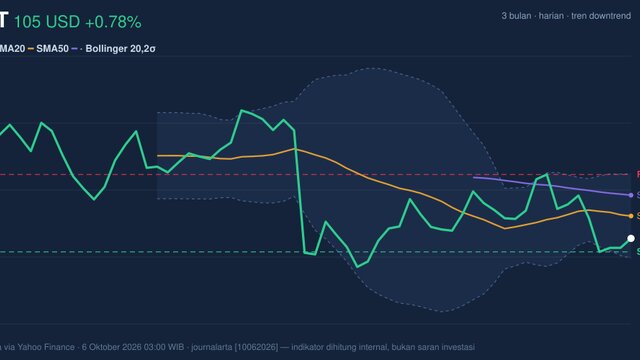
3-month price action chart of PDD: price, SMA20/50, Bollinger, support & resistance. Data: exchange via Yahoo Finance.
Oscillators & Momentum
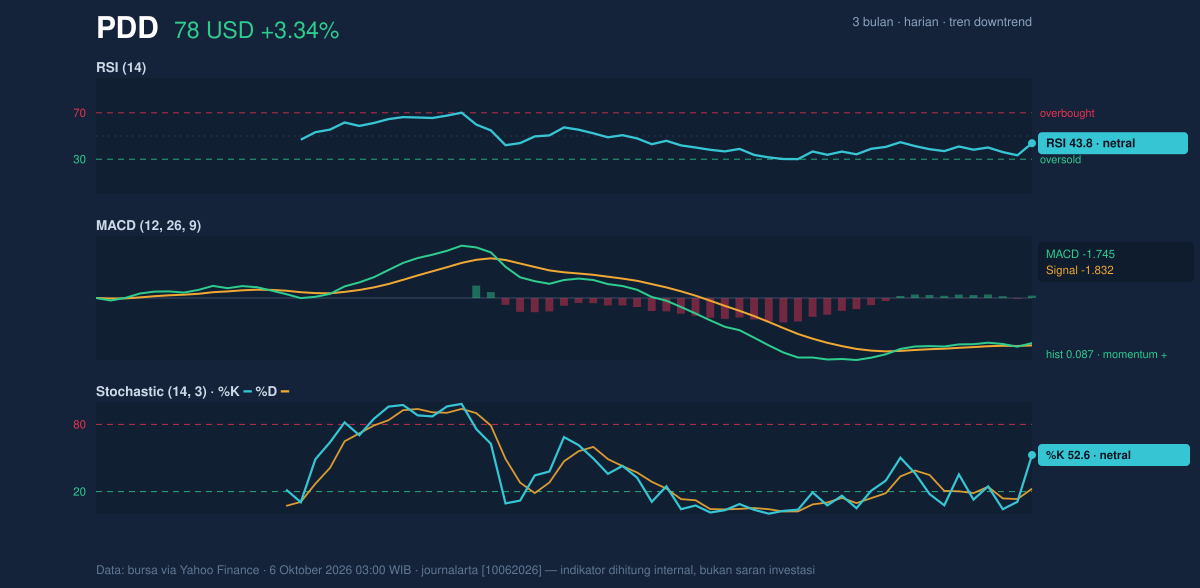
Momentum measures are mixed rather than decisively bearish or bullish. The RSI is 43.8, a neutral reading; the Relative Strength Index gauges the pace of recent gains and losses, and this level does not indicate an extreme condition. The Stochastic is also neutral, with %K at 52.6 and %D at 22.6. This indicator compares a closing price with its recent trading range, and the gap between its lines hints at improving short-term momentum without establishing a broader reversal.
The MACD histogram is positive at 0.087, with MACD at -1.745 and its signal line at -1.832. The histogram measures the gap between those lines; its positive reading means momentum has improved relative to the signal line, even though both remain below zero. That is a tentative lift within a weaker price structure, not a clean trend change.
Momentum chart of PDD: RSI(14), MACD, Stochastic. Data: exchange via Yahoo Finance.
Volatility, Volume & Key Levels
Average True Range, a measure of typical daily price movement, is $1.73, or 2.2% of the share price—consistent with moderate volatility. The narrowing Bollinger Bands suggest the market is in a relatively compressed phase, where a break beyond nearby boundaries may carry more significance than another move within them.
Participation has not yet confirmed the rebound. Latest volume was 5,269,100 shares, about 0.8 times the 20-day average of 6,417,945, while On-Balance Volume (OBV)—a running measure that adds volume on rising sessions and subtracts it on falling ones—is declining. Together, below-average turnover and falling OBV imply the advance has not attracted strong buying participation.
Near-term support sits at $75.38, the 20-day support level and previous close; resistance is $80.35. A sustained move above resistance would bring the upper Bollinger Band at $80.45 into focus and challenge the view that the bounce is only temporary. If the stock fails to hold support, the three-month low of $74.72 becomes the next notable reference. These are conditional scenarios, not predictions.
Technical Verdict: HOLD
HOLD (wait & see) best reflects the conflicting evidence: price remains below both moving averages and the 20-day trend is falling; declining OBV and sub-average volume weaken the latest gain; but positive MACD momentum and neutral oscillators leave room for a further recovery. The verdict is invalidated if price falls below $74.72, the three-month low.
Indicative entry range: $76.07–$78.26, bounded by the lower Bollinger Band and the 20-day average.
Indicative exit target: $80.35–$80.45, spanning near-term resistance and the upper Bollinger Band.
Indicative stop-loss protection: Below $74.72, the three-month low.
In plain English, the rebound needs stronger participation and a sustained break above resistance before the chart can show that the downtrend is fading.
Market data: exchange data via Yahoo Finance, as of 6 October 2026, 03:00 WIB. Technical analysis is not an investment recommendation.