On Oktober 6, 2026: price 54.00 USD, trend downtrend, RSI 24.4, support 53.73, resistance 62.69. technical analysis of bac stock. RSI Oversold — full details…
By matthew jonathan
October 6, 20264 min read
RSI Oversold, BAC Stock Gains 0.47% Today
Bank of America’s shares fell 13.85% over the past month to $54.00, leaving the US lender’s stock near the bottom of its recent trading range as momentum indicators point to heavy selling. The move matters beyond Wall Street: bank shares reflect expectations for lending, funding costs and the health of borrowers across the world’s largest economy.
Trend & Price Action
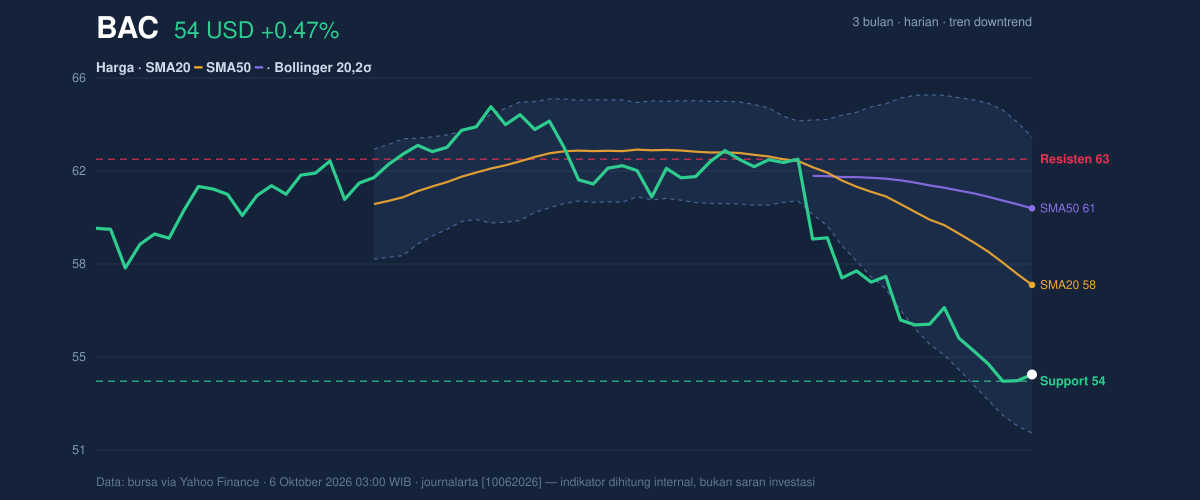
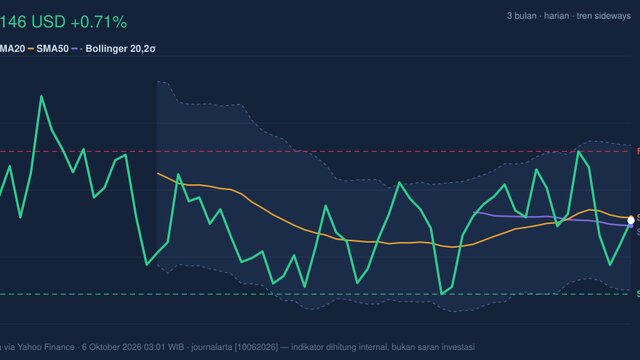
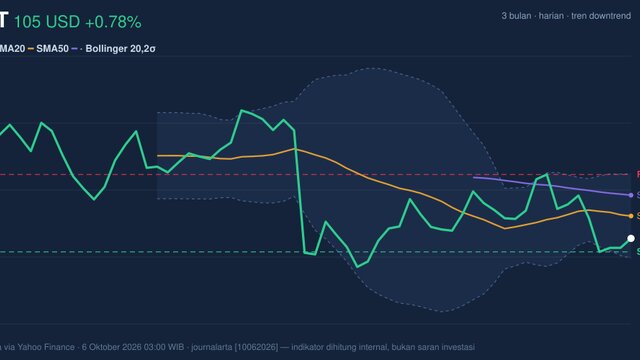
BAC rose 0.47% on the latest session to $54.00, but the one-day gain has not yet reversed the broader decline: the stock lost 2.65% over five days and remains well below its key moving averages. At $54.00, it is under the 20-day simple moving average (SMA) of $57.62 and the 50-day SMA of $60.71. The 20-day average is also falling, down 3.47% over five days, a sign that the short-term trend is still weakening rather than stabilizing.
There has been no new moving-average crossover, so the data do not signal a fresh trend change. Instead, the price structure shows persistent weakness: BAC is only about 3% above its 20-session support of $53.73, and near the lower end of its three-month range, which runs from $52.89 to $65.23. The gap below both moving averages keeps the trend bearish, even after the latest modest rise.
As shown in the chart, price is pressing the lower part of the Bollinger range, while the falling averages and nearby support frame the immediate technical test.
3-month price action chart of BAC: price, SMA20/50, Bollinger, support & resistance. Data: exchange via Yahoo Finance.
Oscillators & Momentum
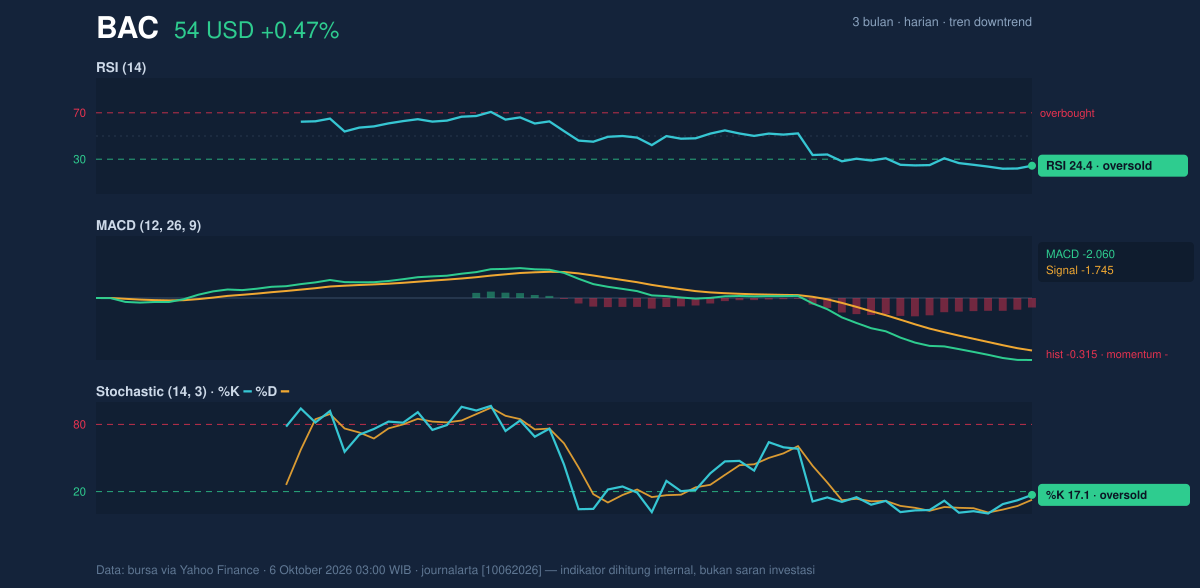
The relative strength index (RSI), which gauges the speed and persistence of recent price changes, is 24.4. That is considered oversold and indicates that selling has been unusually forceful. The Stochastic oscillator, which compares a recent close with its price range, is also oversold: %K is 17.1 and %D is 12.7. Both readings leave room for a short-term bounce, but oversold conditions alone do not confirm that a bottom is in place.
The MACD, a trend-and-momentum measure, remains negative at -2.060 against a signal line of -1.745; its histogram is -0.315. That configuration means downward momentum is still in control. The oscillators therefore present a mixed near-term picture: RSI and Stochastic flag stretched selling, while MACD has not yet turned to confirm a reversal.
Momentum chart of BAC: RSI(14), MACD, Stochastic. Data: exchange via Yahoo Finance.
Volatility & Volume
Bollinger bands are widening, with a 20.8% band width, a sign that price swings have become more pronounced. BAC’s %B reading is 20%, placing the share price in the lower part of the band between $51.63 and $63.60. The widening bands and low %B point to elevated downside pressure, but also make abrupt countertrend moves more plausible.
Average true range (ATR), a measure of typical daily movement, is $1.07, or 2.0% of the share price, indicating moderate volatility by this measure. The latest volume was 34,975,200 shares, about 0.9 times the 20-session average of 39,362,105. That is not a surge in trading activity, but the falling on-balance volume (OBV)—a running measure that adds volume on rising sessions and subtracts it on falling ones—suggests participation has generally favored sellers.
Key Levels & Scenarios
The first test is support at $53.73, close to the latest price. If BAC holds that level, the oversold RSI and Stochastic readings could support a relief bounce, with the 20-day SMA at $57.62 a first reference point for whether the recovery gains traction. A sustained move above that average would be a more meaningful improvement than a single-session rise.
If support gives way, the three-month low of $52.89 becomes the next reference in the supplied data. On the upside, resistance at $62.69 sits below the three-month high of $65.23 and close to the 50-day SMA at $60.71; these levels mark a substantial hurdle for any broader reversal. A break below $53.73 would weaken the near-term setup further, while a recovery above $57.62 would be an early sign that selling pressure is easing.
Technical Verdict: HOLD (wait & see)
The indicators support a cautious, non-directional verdict rather than a confirmed reversal. The falling SMA20 and price below both moving averages show the downtrend remains intact; negative MACD confirms weak momentum; and oversold RSI and Stochastic readings raise the possibility of a bounce without establishing one. This HOLD verdict is invalidated if the price falls below $53.73.
- Ideal Entry Range: $53.73–$57.62, bounded by near-term support and the 20-day SMA; this range is a technical reference, not a forecast.
- Exit Target: $60.71–$62.69, using the 50-day SMA and 20-session resistance as reference levels.
- Stop Loss: Below $53.73, the 20-session support; the three-month low at $52.89 is a further downside reference.
In plain English, BAC is oversold but still in a declining trend, so the chart has not yet shown that sellers have lost control.
Market data: exchange data via Yahoo Finance, as of 6 October 2026, 03:00 WIB.