WMT Stock Analysis: Gains 0.78%, Testing Support Level
On Oktober 6, 2026: price 105.07 USD, trend downtrend, RSI 43.3, support 103.92, resistance 110.53. technical analysis of wmt stock. WMT Stock Analysis — full…
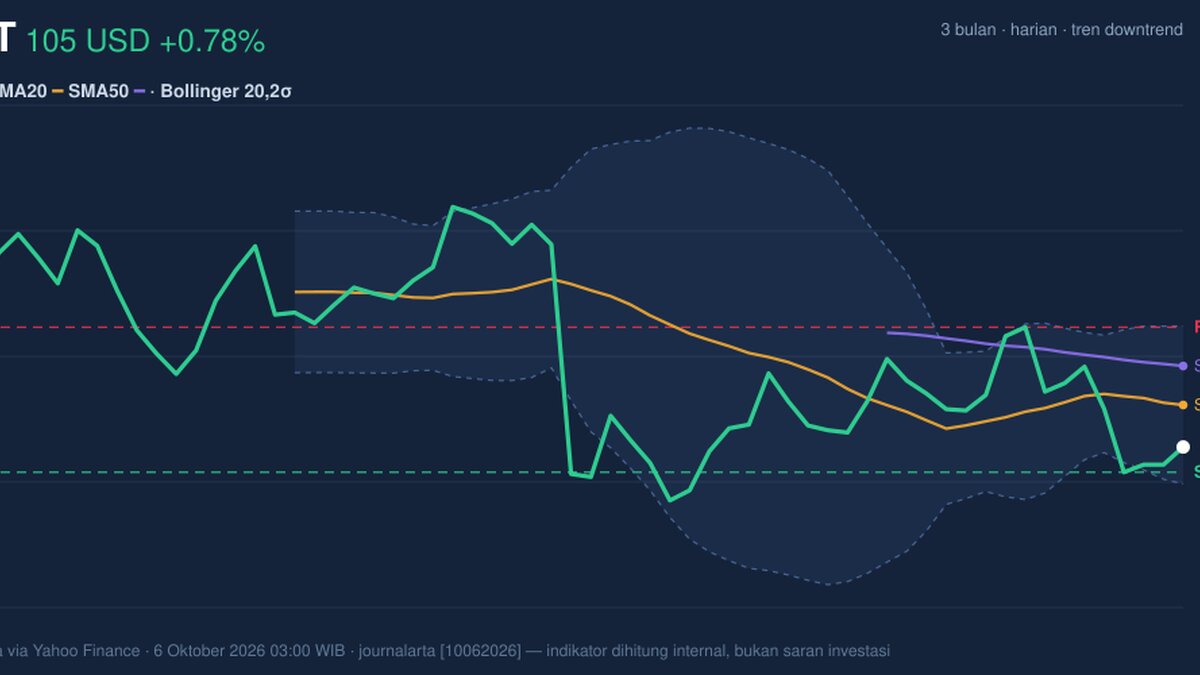
Walmart’s shares rose 0.78% to $105.07 on the latest session, but remain below both key moving averages, leaving the daily gain at odds with a weaker short-term trend. For international investors, that matters because the retailer’s share price is trading near the lower end of its recent range, while a narrowing volatility band suggests a larger move may be approaching without indicating its direction.
Trend & Price Action
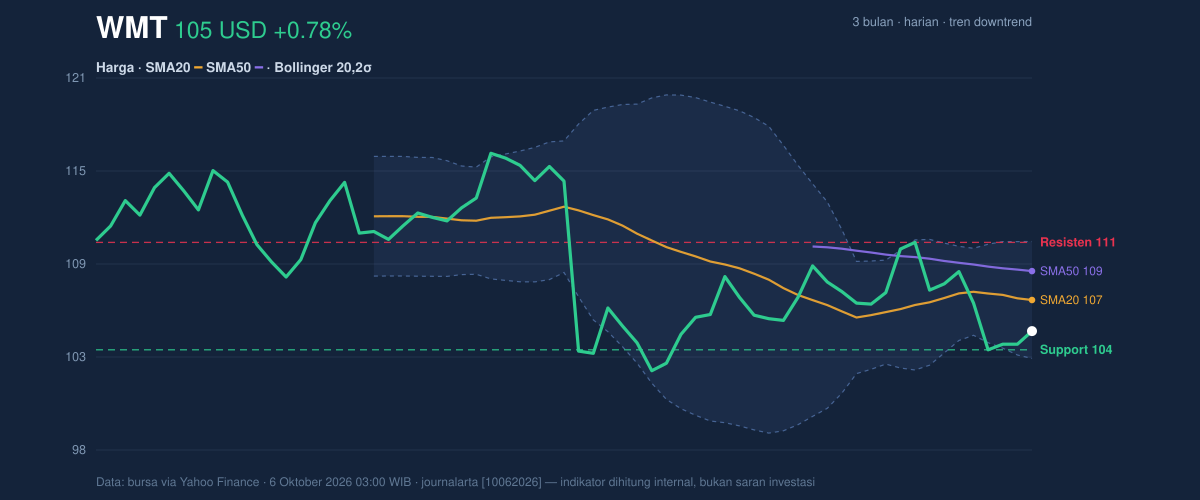
Walmart’s stock has fallen 3.37% over five days and 1.93% over one month. The price is below its 20-day simple moving average (SMA), at $106.98, and its 50-day SMA, at $108.76. The 20-day average is also sloping down, declining 0.38% over five days. Together, those readings point to persistent near-term pressure rather than a confirmed recovery; the data shows no recent crossover between the two averages.
At $105.07, the shares are about 17% of the way up their 20-session range from support at $103.92 to resistance at $110.53. They are also closer to the three-month low of $102.15 than to the high of $118.09. That positioning puts the lower end of the range in focus: a hold near support could stabilize the price, while a break below it would weaken the chart further.
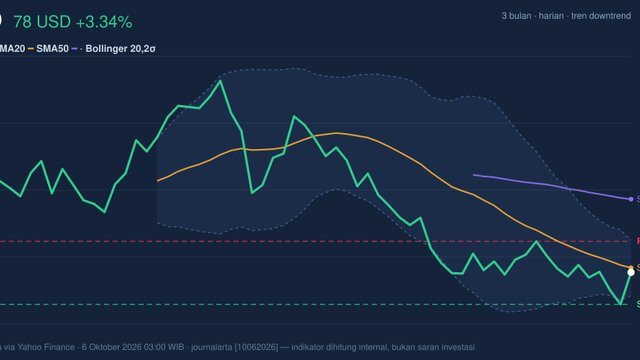
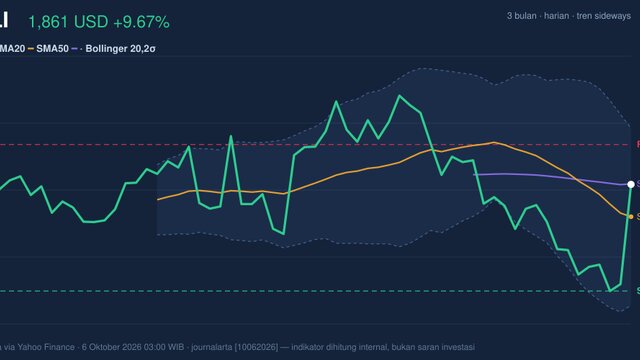
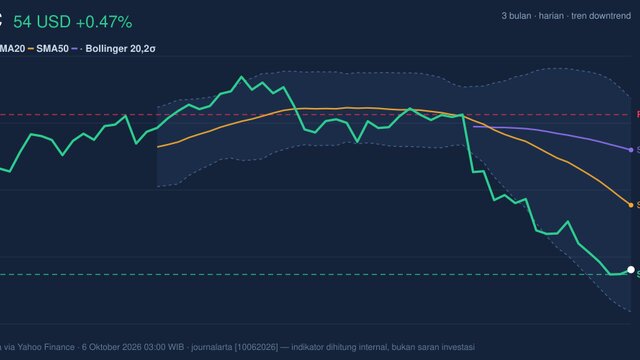
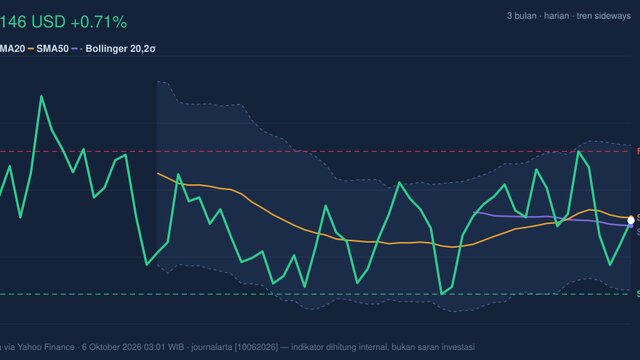
As shown in the chart, the Bollinger Bands—a measure of price movement around a moving average—run from $103.38 at the lower band to $110.58 at the upper band, with the midpoint at $106.98. The price sits at 23% of the way between the bands, consistent with its position in the lower part of the range. Band width is 6.7% and narrowing, a squeeze that signals subdued recent movement and the possibility of a breakout, but does not establish which way it will go.
Oscillators & Momentum
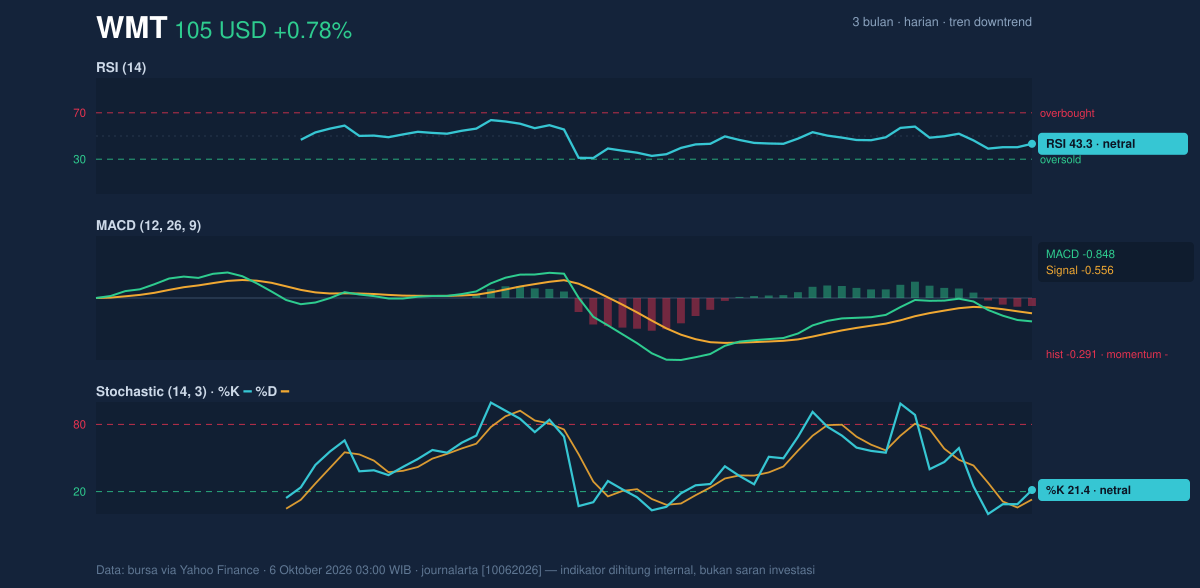
Momentum measures remain mixed, though the MACD leans negative. RSI, which compares the scale of recent gains and losses, is 43.3, a neutral reading; it does not show an extreme that would by itself signal an imminent reversal. The Stochastic oscillator, which compares a closing price with its recent trading range, is also classified as neutral: %K is 21.4 and %D is 13.0. These low readings show the price is toward the bottom of its recent range, but the supplied signals do not confirm a bullish turn.
The MACD is negative at -0.848, below its -0.556 signal line, with a -0.291 histogram. The histogram measures the gap between the MACD and its signal line; its negative value is consistent with downward momentum. That weak confirmation matters because the one-day gain has not yet brought the share price back above its 20-day average.
Volatility, Volume & Key Levels
Average True Range (ATR), a measure of typical daily price movement, is $2.08, or 2.0% of the share price, indicating moderate volatility. Trading volume was 19,220,800 shares, about 0.9 times the 20-session average of 22,268,305. The lighter-than-normal activity offers limited evidence that buyers are strongly backing the latest daily rise. On the other hand, On-Balance Volume (OBV), which tracks whether volume accompanies up or down sessions, is rising—an encouraging counter-signal that has not yet overturned the price trend.
The nearest technical test is support at $103.92, with the lower Bollinger Band at $103.38 and the three-month low at $102.15 providing additional reference points. If the price holds above support and recovers the 20-day SMA, it would ease immediate pressure; a move through resistance at $110.53 would be a stronger sign of improvement. If support fails, the three-month low becomes the next notable level in the supplied data.
Technical Verdict: HOLD (wait & see)
HOLD (wait & see) is the chart-based verdict: the declining moving-average trend and negative MACD argue for caution, while rising OBV and neutral RSI leave room for stabilization rather than confirming a fresh leg lower. The narrowing Bollinger Bands warn of a possible expansion in price movement, but offer no directional confirmation.
- Ideal Entry Range: $103.92–$106.98, bounded by 20-session support and the 20-day SMA.
- Exit Target (Target Price): $110.53, the 20-session resistance level.
- Stop Loss protection: Below $102.15, the three-month low; a move beneath that level would invalidate this HOLD assessment.
For non-traders, the indicators point to a stock that has not yet shown enough strength to confirm a recovery, while its support level remains important to watch.
| Metric | Reading |
|---|---|
| Last price | $105.07 |
| Daily change | +0.78% |
| SMA20 / SMA50 | $106.98 / $108.76 |
| RSI / MACD | 43.3 / -0.848 |
| Support / Resistance | $103.92 / $110.53 |
| Data source and timestamp | Exchange data via Yahoo Finance, 6 October 2026, 03:00 WIB |
Summary Data WMT
| Last price | 105.07 USD |
| Change 1 day / 5 days / 1 month | 0.78% / -3.37% / -1.93% |
| Trend / MA-cross | downtrend / none |
| SMA20 / SMA50 | 106.98 / 108.76 |
| RSI (14) / Stochastic %K | 43.3 / 21.4 |
| Bollinger %B / ATR | 23% / 2.08 |
| Support / Resistance 20 days | 103.92 / 110.53 |
| Data as of | 6 Oktober 2026 03:00 WIB |
Track WMT stock price daily: live levels, support/resistance and our full WMT analysis history.