Momentum Weakens, MELI Stock Gains 9.67% Today
On Oktober 6, 2026: price 1,860.61 USD, trend sideways, RSI 55.0, support 1,685.12, resistance 1,926.25. technical analysis of meli stock.
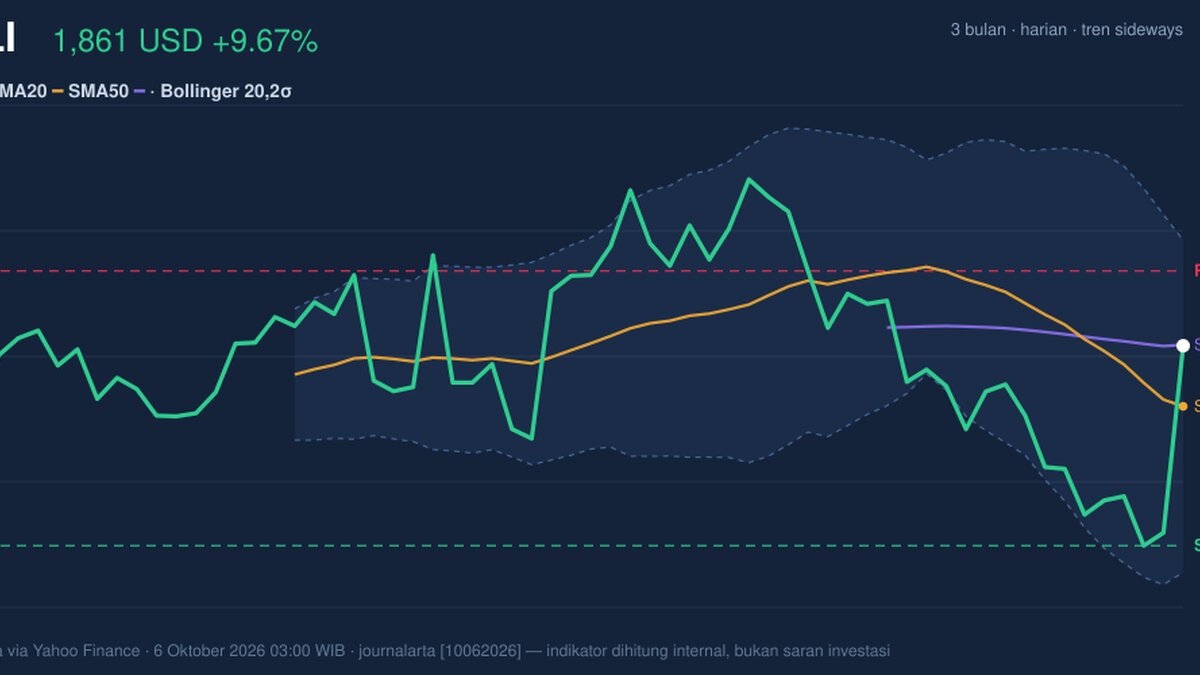
MELI’s 9.67% one-day surge puts MercadoLibre at the center of a sharp rebound, but mixed momentum signals leave open whether the move marks a durable turn or a powerful bounce within a sideways trend. The Nasdaq-listed shares rose to $1,860.61, from $1,696.56 at the previous close, according to exchange data via Yahoo Finance as of October 6, 2026, 03:00 WIB.
The move extends gains of 8.65% over five days, while the stock remains down 5.95% over a month. That contrast matters: buyers have returned in force, but the longer short-term picture has yet to confirm a sustained recovery.
Trend & Price Action
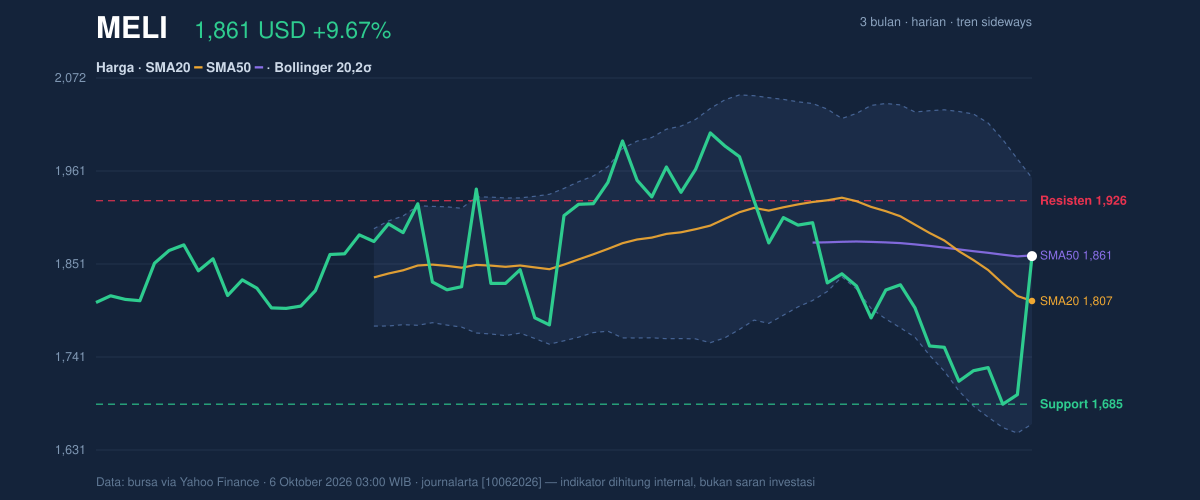
MercadoLibre trades above its 20-day simple moving average (SMA), at $1,807.44, but almost exactly at its 50-day average of $1,861.44. A simple moving average tracks the average closing price over a set period, smoothing daily fluctuations. The price’s position between these measures, combined with a 20-day average declining 3.16% over five days, points to a sideways market rather than a clearly established uptrend. There has been no new moving-average crossover.
The share price sits at 73% of its recent 20-day range, between support at $1,685.12 and resistance at $1,926.25. It is also below its three-month high of $2,066.00 and above the period low of $1,668.44. That leaves room for a test of resistance, but the upper part of the range is where sellers may reappear.
As shown in the chart, the price has moved above the 20-day average, but is pressing against the 50-day line and remains inside the Bollinger Bands. The bands measure how far prices have moved from their recent average; they help frame whether a move is unusually extended, not predict its direction.
Oscillators & Momentum
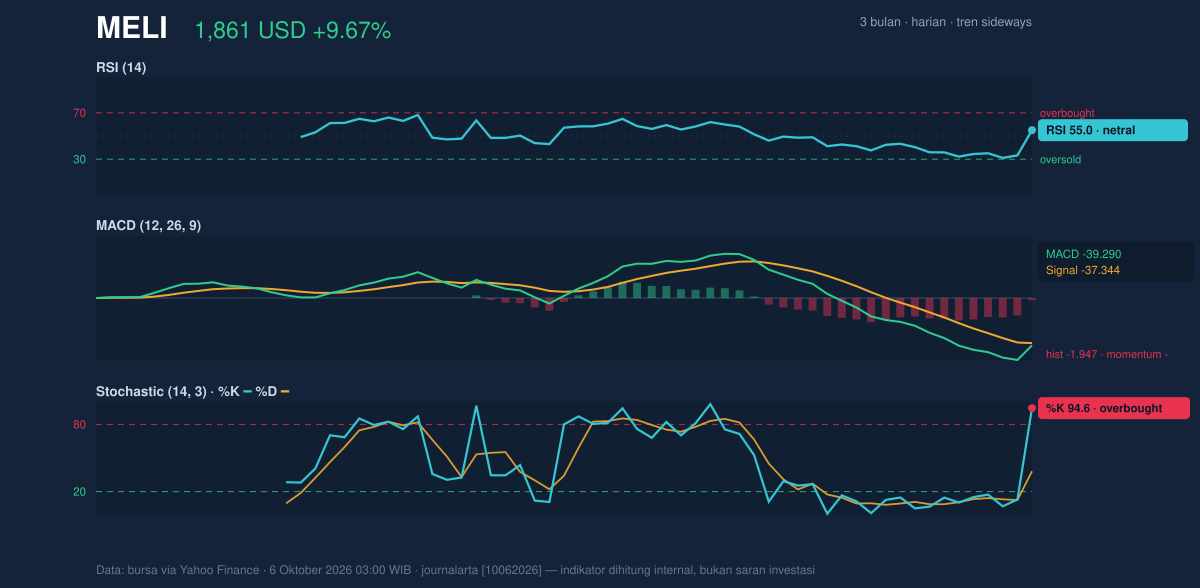
The momentum indicators do not yet speak with one voice. RSI is neutral at 55.0, suggesting neither unusually strong buying nor selling pressure under this measure. By contrast, the Stochastic reading is overbought, with %K at 94.6 against %D at 38.1. Stochastic compares a closing price with its recent trading range; an elevated reading can signal that a rally has run hard, though it does not by itself establish that a reversal is imminent.
The MACD indicator remains negative: MACD is -39.290, below its -37.344 signal line, with a negative histogram of -1.947. MACD compares shorter- and longer-term price averages to assess momentum. Its readings suggest that the recent jump has not yet reversed the weaker underlying momentum captured by the indicator.
That divergence is central to the setup. The price rebound and neutral RSI are constructive, but the negative MACD and stretched Stochastic counsel caution about treating one strong session as confirmation.
Volatility & Volume
Trading volume reached 1,259,000 shares, about 1.8 times the 20-day average of 698,470, while on-balance volume (OBV) rose. OBV adds or subtracts trading volume according to whether a session closes higher or lower; its rise alongside the price jump indicates that the rally drew broader participation, rather than occurring on unusually light turnover.
The Bollinger %B reading is 68%, placing the price above the bands’ midpoint but below the upper boundary at $1,953.15. The lower band is $1,661.74, and the 16.1% band width is classified as normal, not a squeeze. There is no Bollinger signal of an unusually compressed market immediately preceding the surge.
Average True Range (ATR), a measure of typical daily movement, is $59.39, or 3.2% of the share price. That points to moderate volatility: enough movement for levels to be tested quickly, but not an exceptionally wide daily range in the data provided.
Key Levels & Scenarios
A move through $1,926.25 resistance would put the upper Bollinger boundary at $1,953.15 in view as the next reference point in the supplied data. A failure to hold above the 20-day average at $1,807.44 would weaken the rebound, with the 20-day support at $1,685.12 becoming a key lower level. These are conditional technical markers, not forecasts.
Technical Verdict: HOLD (wait & see)
The indicators support a wait-and-see reading rather than a decisive directional signal. The strongest reasons are the price holding above the 20-day average, a volume-backed one-day surge with rising OBV, and still-negative MACD momentum alongside an overbought Stochastic reading. The verdict is invalidated if price falls below $1,685.12, the stated 20-day support.
- Indicative entry range: $1,807.44–$1,861.44, around the 20- and 50-day averages.
- Indicative exit target: $1,926.25–$1,953.15, from 20-day resistance to the upper Bollinger Band.
- Indicative stop-loss protection: below $1,685.12, the 20-day support level.
In plain English, the rally has real participation behind it, but the indicators have not yet confirmed a lasting change in trend.
Summary Data MELI
| Last price | 1,860.61 USD |
| Change 1 day / 5 days / 1 month | 9.67% / 8.65% / -5.95% |
| Trend / MA-cross | sideways / none |
| SMA20 / SMA50 | 1,807.44 / 1,861.44 |
| RSI (14) / Stochastic %K | 55.0 / 94.6 |
| Bollinger %B / ATR | 68% / 59.39 |
| Support / Resistance 20 days | 1,685.12 / 1,926.25 |
| Data as of | 6 Oktober 2026 03:00 WIB |
Track MELI stock price daily: live levels, support/resistance and our full MELI analysis history.