MA Testing Key Resistance: Stock Gains 0.02% (Agustus 21, 2026)
On Agustus 21, 2026: price 573.85 USD, trend uptrend, RSI 62.2, support 539.66, resistance 577.35. technical analysis of ma stock. MA Testing Key Resistance —…
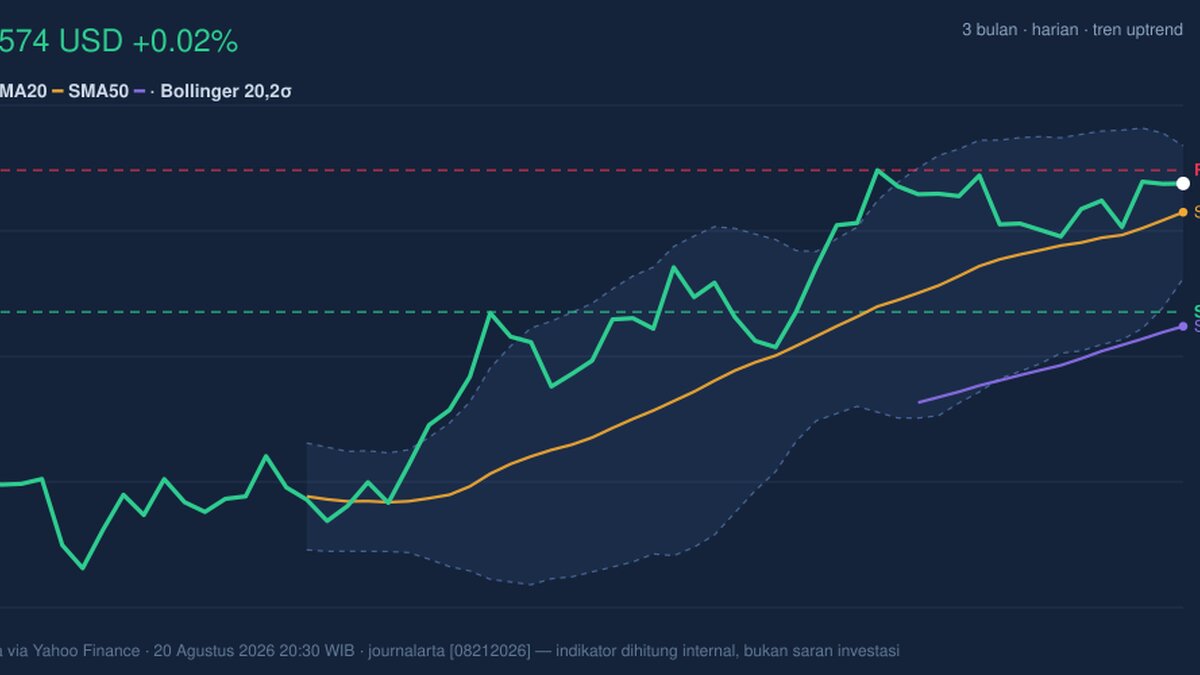
Mastercard (MA) at $573.85 was little changed in the latest New York session, edging up just 0.02% from the previous close, according to Yahoo Finance data cited on the NYSE feed. That calm headline masks a more interesting setup: the shares are still in an uptrend, sitting above both the SMA20 at $566.21 and the SMA50 at $535.85, but momentum has started to cool even as price presses near the top of its recent range. In plain terms, Mastercard is still being bought on dips, yet the market is no longer accelerating with the same force. The stock is trading close to its 3-month high of $583.71, and that matters because it tells investors the current move is not a rebound from weakness — it is a test of whether the trend has enough energy left to extend.
Trend & Price Action
The structure remains constructive. With price above the SMA20 and the SMA50, the medium-term trend is still pointing higher, and the SMA20 slope of 1.45% over 5 days shows the short-term trend is rising rather than flattening. That rising average is important because it often acts like a moving floor: when price stays above it, the market is signaling that recent buyers are still in control. The absence of a fresh MA-cross is equally telling. A “golden cross” or “death cross” can grab attention, but here the message is subtler: Mastercard does not need a dramatic crossover to remain firm, because the trend is already established. What matters now is whether the stock can hold above the middle Bollinger band at $566.21 while challenging overhead supply.
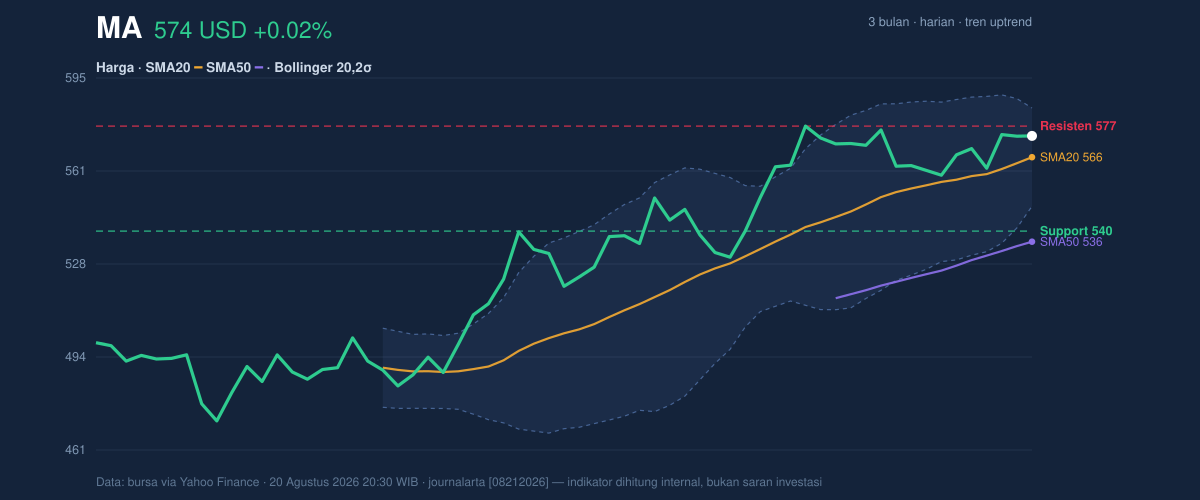
As shown in the chart, the shares are sitting at 91% of the 20-day range, which means they are trading very close to the upper end of the recent band. That positioning is bullish in the sense that it reflects strength, but it also leaves less room for error. The nearest resistance is $577.35, only a few dollars above the last price, while the broader ceiling sits at the upper Bollinger band of $583.86 and the 3-month high of $583.71. When a stock trades this near a known ceiling, the question becomes not whether the trend exists, but whether it can absorb selling from traders who may use prior highs as a place to take profits.
Oscillators & Momentum
The momentum picture is mixed, and that is where the story gets more nuanced. The RSI at 62.2 is still neutral, not overbought, which means Mastercard has room to run before momentum becomes stretched. The Stochastic %K at 64.3 and %D at 64.7 also sit in neutral territory, showing neither panic selling nor an overextended rally. But the MACD at 9.441 is below the signal line at 10.591, and the histogram at -1.150 is negative. That negative histogram matters because it shows the short-term pace of the rally has slipped behind the longer-term trend. In simple language: the stock is still climbing, but the climb is less forceful than before.
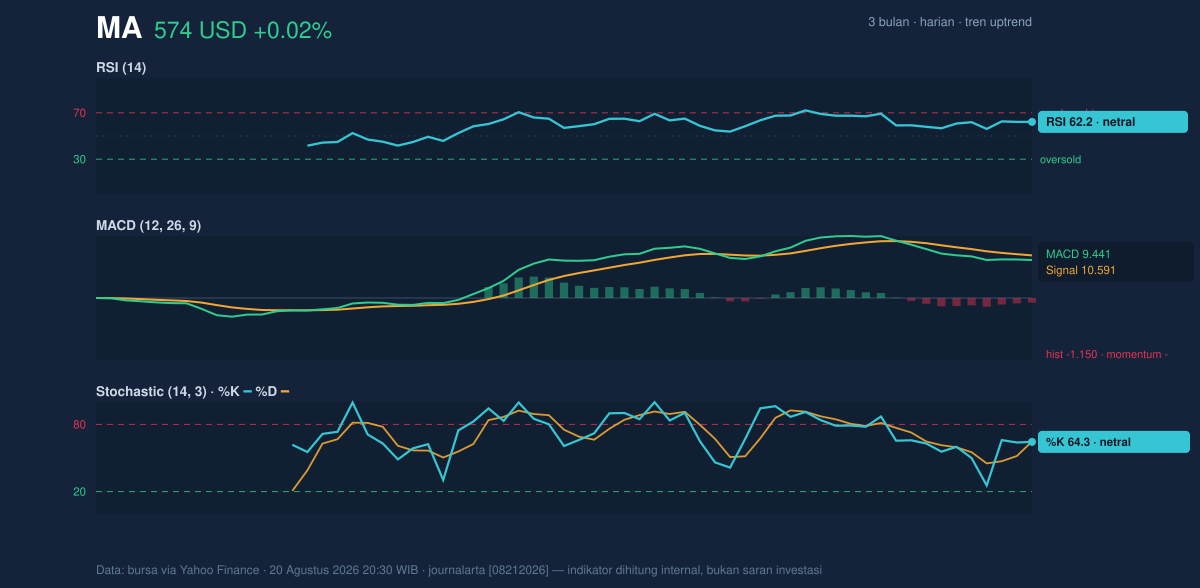
This is the kind of setup that often precedes either a pause or a breakout. The indicators are not screaming reversal; they are warning that buyers need to prove themselves again. A neutral RSI and stochastic reading alongside a negative MACD histogram often means the market is waiting for confirmation rather than conviction. If price pushes through resistance while momentum turns up, the move can broaden. If it stalls, the same indicators can quickly shift from “healthy pause” to “loss of steam.”
Volatility & Volume
Volatility is moderate, with ATR(14) at 10.02, or 1.7% of price. That tells readers the stock is not in a high-stress, whipsaw phase; daily movement is contained enough for the market to absorb news without a disorderly break. More important is the Bollinger setup: the bands are relatively tight, with width at 6.2%, and the structure is described as a squeeze. A squeeze often means the market is storing energy. It does not predict direction, but it does suggest a larger-than-usual move can follow once price escapes the band. Right now, Mastercard is trading with %B at 72%, which places it in the upper part of the band and reinforces the idea that buyers are still pressing the stock toward resistance.
Volume, however, is not confirming with conviction. The latest volume of 2,612,700 was below the 20-day average of 3,094,120, or about 0.8x normal, and OBV is falling. That combination matters because rising prices are more trustworthy when they come with rising participation. Lower-than-average volume and declining OBV suggest the advance is being carried by fewer shares, not broader accumulation. In other words, the rally still exists, but the crowd behind it is thinner than the chart would ideally want at this stage.
Key Levels & Scenarios
The immediate map is clear. First support sits at $539.66, while the more important dynamic support is the SMA20 at $566.21 and the Bollinger middle band at the same level. Resistance is clustered around $577.35, then the $583.86 upper Bollinger band and the $583.71 3-month high. Because the stock is already near the top of its recent range, the next move is likely to be decisive rather than gradual. If Mastercard can push through $577.35 with improving momentum, the chart would be signaling a continuation of the trend rather than a simple drift. If it slips back under $566.21, the message changes: the market would be failing to hold the short-term trend line that has supported the advance.
Technical Verdict: HOLD (wait & see)
- Reason 1: Price remains above the SMA20 and SMA50, and the trend is still up.
- Reason 2: RSI 62.2 and Stochastic 64.3/64.7 are neutral, but MACD is below signal with a -1.150 histogram, showing fading momentum.
- Reason 3: The Bollinger squeeze suggests a breakout could come, but volume is 0.8x normal and OBV is down, so participation is not yet confirming strength.
- Verdict invalidated if price breaks below $539.66, which would damage the broader support structure.
Ideal Entry Range: $566.21 to $577.35
Exit Target: $583.71 to $583.86
Stop Loss protection: below $539.66
For non-traders, that means Mastercard still looks firm, but the stock needs stronger proof before the next leg higher can be trusted. “The market is asking for confirmation, not applause.”
Summary Data MA
| Last price | 573.85 USD |
| Change 1 day / 5 days / 1 month | 0.02% / 1.20% / 8.21% |
| Trend / MA-cross | uptrend / none |
| SMA20 / SMA50 | 566.21 / 535.85 |
| RSI (14) / Stochastic %K | 62.2 / 64.3 |
| Bollinger %B / ATR | 72% / 10.02 |
| Support / Resistance 20 days | 539.66 / 577.35 |
| Data as of | 20 Agustus 2026 20:30 WIB |
Track MA stock price daily: live levels, support/resistance and our full MA analysis history.