MELI Stock Gains 0.70% Today, Testing Key Resistance
On Agustus 21, 2026: price 1,921.96 USD, trend uptrend, RSI 58.8, support 1,779.14, resistance 1,940.00. technical analysis of meli stock.
MercadoLibre is still climbing, but the latest move shows a market that is advancing with less conviction than the price alone suggests.
MercadoLibre (MELI) last traded at 1,921.96 USD, up 0.70% on the day and 5.13% over five days, according to Nasdaq-linked data via Yahoo Finance. That keeps the stock in a clear short-term uptrend, yet the internal signals are starting to split: price is holding above its trend lines, while momentum tools are showing a late-stage push rather than a fresh acceleration. In plain terms, the shares are still rising, but the fuel behind the rise looks thinner.
Trend & Price Action
The main structural signal remains constructive. MELI is trading above its SMA20 at 1,856.70 and well above its SMA50 at 1,782.40, which tells traders the stock is still carrying upward bias across both the short and medium term. The SMA20 slope of 0.47% over five days confirms that the near-term trend is still rising, not flattening out. There is no fresh MA-cross, so the chart is not flashing a new trend reversal signal.
That said, price is no longer sitting in the middle of its range. It is trading at 89% of the 20-hour range, with 1,940.00 acting as nearby resistance and the stock only a step below the 3-month high of 1,946.00. That positioning matters: when a stock is this close to the top of its recent range, the market is usually asking whether buyers have enough power to force a breakout or whether the move is already stretched.
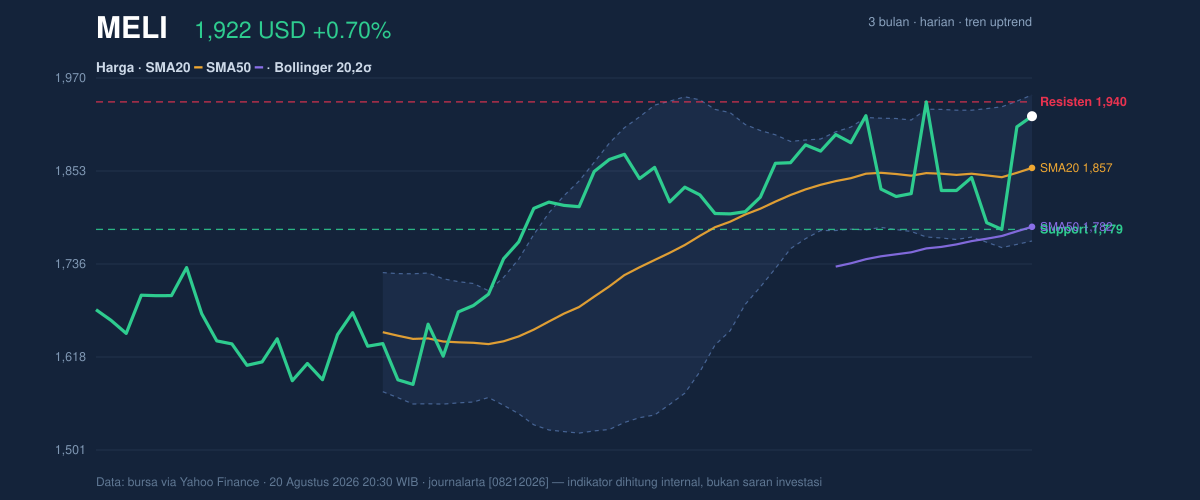
The chart also shows price sitting near the upper Bollinger band, which often means the market is pressing against the edge of its recent volatility envelope rather than moving through the center of it.
Oscillators & Momentum
Momentum is where the story becomes more nuanced. The RSI at 58.8 is still neutral, which means the stock is not yet in the classic overbought zone. But the Stochastic %K at 87.1 and %D at 59.3 are already in overbought territory, signaling that the most recent price push has moved faster than the broader trend may comfortably support. That kind of setup often appears when a stock is running near a short-term ceiling.
The more important warning comes from MACD. The MACD at 17.748 remains above zero, which usually supports the broader trend, but it is still below the signal line at 19.391, leaving a negative histogram of -1.644. In practical terms, that means the trend is still up, but the pace of upside momentum has weakened enough to create a short-term drag. This is not a full reversal signal. It is a sign that buyers are losing some urgency.
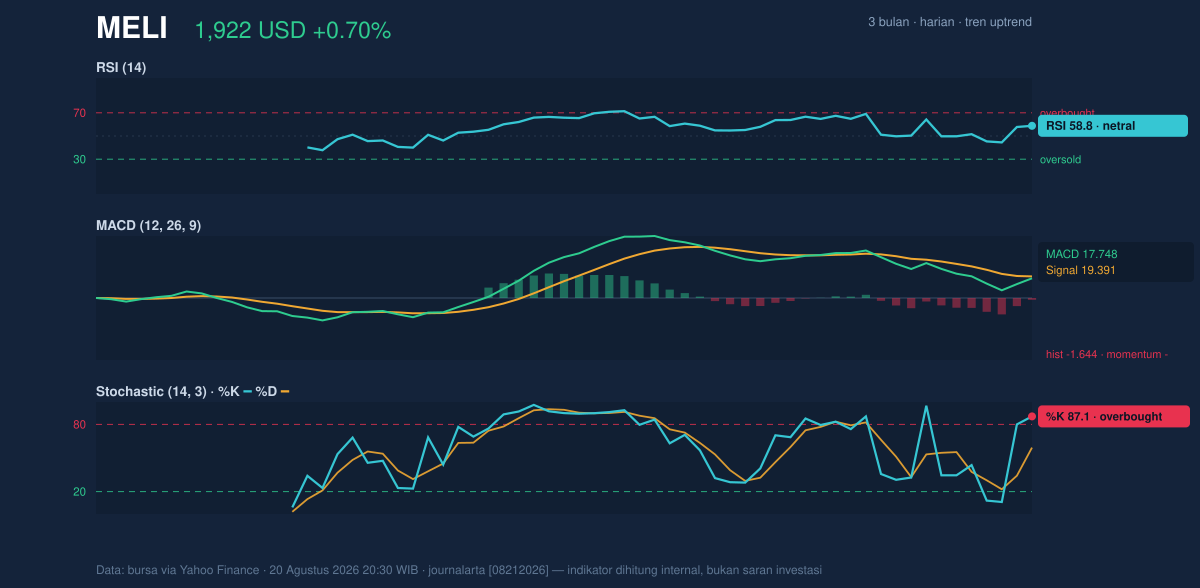
That mix — neutral RSI, overbought Stochastic, and a negative MACD histogram — is the kind of combination that often shows up when a stock is strong but no longer fresh.
Volatility & Volume
Volatility is elevated. The ATR(14) at 74.73, equal to 3.9% of price, suggests daily moves can remain wide even if the trend is intact. That matters because a stock near resistance can either break out sharply or snap back quickly; high ATR means both outcomes can be larger than usual.
Bollinger Bands add a similar message. The upper band sits at 1,948.81, the middle band at 1,856.70, and the lower band at 1,764.59. With %B at 85% and a normal band width of 9.9%, MELI is trading high in its recent volatility range but without a squeeze that would hint at an imminent explosive expansion. In other words, the stock is elevated, but not compressed.
Volume is less convincing than price. The latest volume of 399,500 was only 0.8x normal versus the 20-session average of 483,910. That means the rise is not being backed by unusually strong participation. The encouraging counterweight is that OBV is rising, which suggests buyers have still been accumulating over time even if the latest session did not come with a volume surge.
When price pushes toward highs on lighter volume, traders usually watch for confirmation rather than assuming continuation.
Key Levels & Scenarios
The immediate technical map is clear. 1,940.00 is the first meaningful resistance, and it sits just below the 3-month high of 1,946.00 and the Bollinger upper band at 1,948.81. A clean move through that zone would matter because it would show the stock is not just testing the top of the range, but actually clearing it.
On the downside, the first major support is 1,779.14. That level is important because it roughly aligns with the lower part of the recent trading range and sits close to the SMA50 at 1,782.40. If price slips back there, the market would be saying the recent breakout attempt has faded and the medium-term trend is being retested.
The wider context is still favorable: the 3-month low at 1,546.00 is far below current levels, showing how much of the earlier base has already been reclaimed. But from here, the next move depends less on where the stock has been and more on whether it can hold its recent gains without momentum rolling over further.
Technical Verdict: HOLD (wait & see)
HOLD (wait & see)
- Why: the stock remains above the SMA20 and SMA50, and the uptrend is still intact.
- Why: RSI 58.8 is neutral, but Stochastic 87.1 is overbought and MACD histogram -1.644 shows momentum is weakening.
- Why: price is already near 1,940.00, close to the 3-month high of 1,946.00 and the Bollinger upper band of 1,948.81, while volume is only 0.8x normal.
- Verdict invalidated if price breaks below 1,779.14, because that would undercut the key support and pull the stock back toward the SMA50 at 1,782.40.
- Ideal entry range: 1,856.70 to 1,940.00
- Exit target: 1,946.00 to 1,948.81
- Stop loss protection: below 1,779.14
For non-traders, this means MELI still looks strong, but the chart is asking for proof that the latest climb can continue.
Summary Data MELI
| Last price | 1,921.96 USD |
| Change 1 day / 5 days / 1 month | 0.70% / 5.13% / 6.85% |
| Trend / MA-cross | uptrend / none |
| SMA20 / SMA50 | 1,856.70 / 1,782.40 |
| RSI (14) / Stochastic %K | 58.8 / 87.1 |
| Bollinger %B / ATR | 85% / 74.73 |
| Support / Resistance 20 days | 1,779.14 / 1,940.00 |
| Data as of | 20 Agustus 2026 20:30 WIB |
Track MELI stock price daily: live levels, support/resistance and our full MELI analysis history.