PANW Momentum Weakens: Stock Drops 2.84% (Agustus 21, 2026)
On Agustus 21, 2026: price 349.56 USD, trend sideways, RSI 47.9, support 314.15, resistance 396.00. technical analysis of panw stock. PANW Momentum Weakens —…
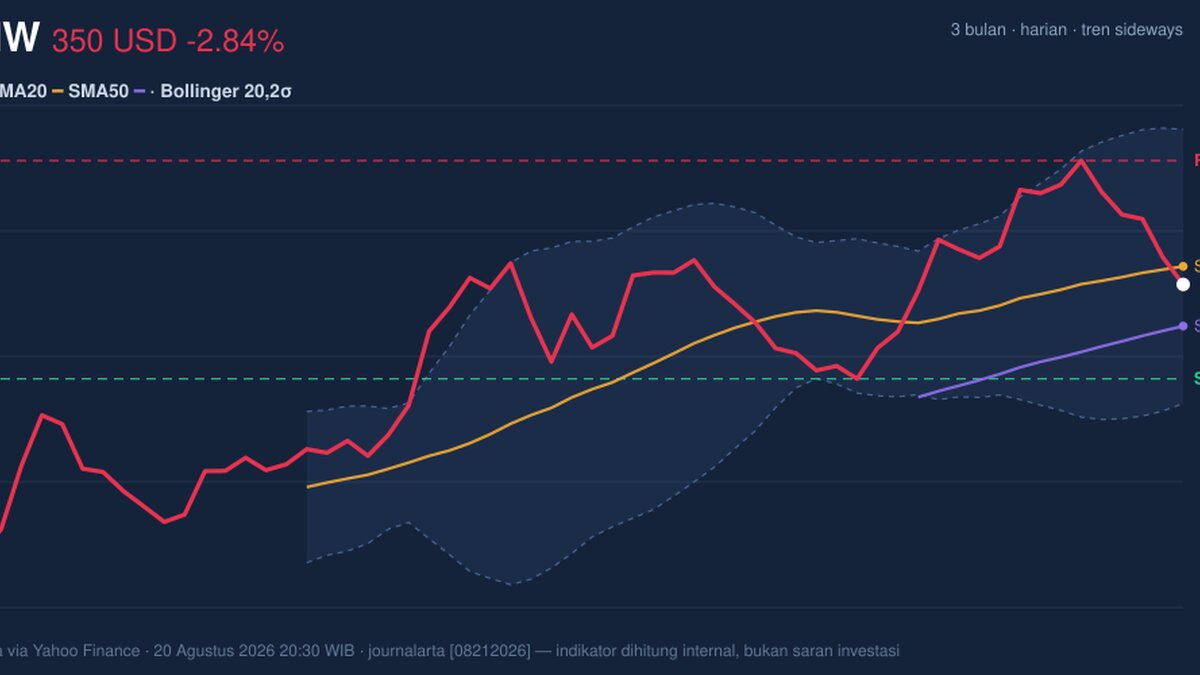
Palo Alto Networks slipped to 349.56 on Nasdaq, down 2.84% from the previous close of 359.76. The move matters because it put the cybersecurity group below its 20-day average of 356.33 even as the 50-day average at 333.95 still sits underneath, leaving the chart in a sideways but fragile posture rather than a clean trend. As shown in the chart, the stock is now trading in the middle of its recent band, but the signals underneath the price are less balanced than the headline range suggests.
Trend & Price Action
The broader setup remains sideways, with the SMA20 slope at 1.90% over 5 days pointing to a modest upward tilt in the short term. That is not the same as a confirmed breakout. A sideways label usually means the market has not yet chosen a direction, and PANW’s latest move below the SMA20 shows sellers are still able to lean on rallies.
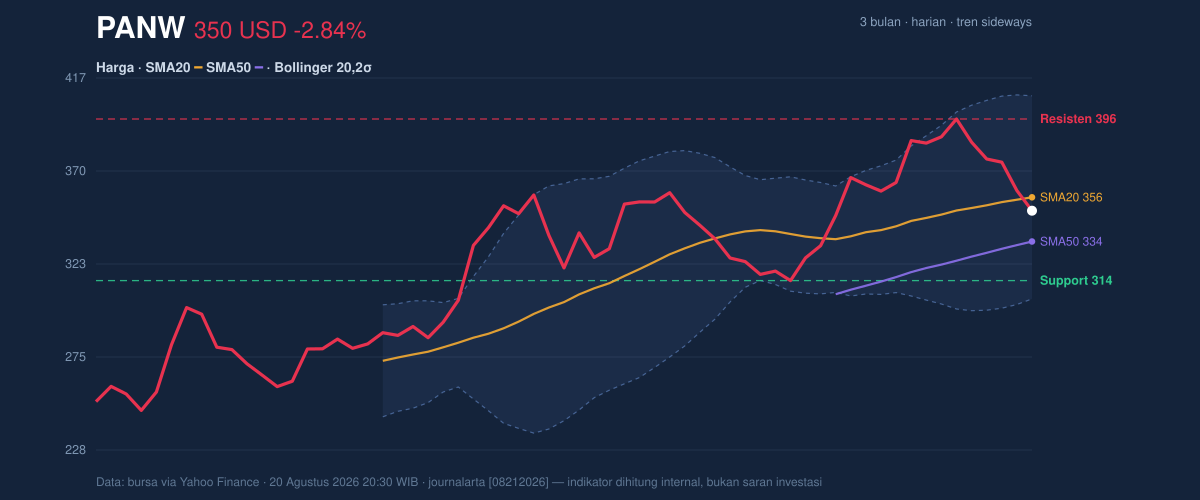
The stock’s position inside the Bollinger envelope helps explain the tone. With the upper band at 407.73, the middle band at 356.33, and the lower band at 304.93, PANW is sitting just under the center line, or the area that often acts like a short-term balance point. Its %B of 43% means price is below the midpoint of the band structure, not oversold, but also not pressing the upper half where momentum typically strengthens. The band width of 28.9% is expanding, which signals the market is preparing for a larger move than the recent drift has shown.
That matters because expanding bands often come after compression or indecision, and they can precede sharper directional swings. In plain English: the stock is no longer coiling quietly. It is becoming more capable of a fast move, but the direction is not yet confirmed.
Oscillators & Momentum
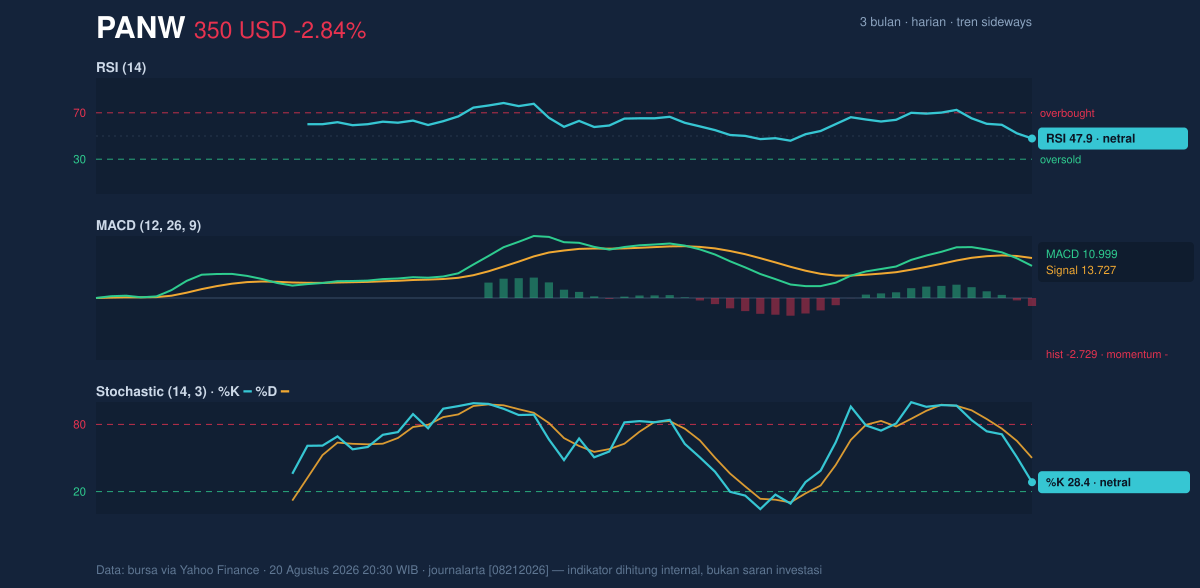
The momentum picture is softer than the price structure. RSI at 47.9 is neutral, which means the stock is neither stretched on the upside nor washed out on the downside. That sounds calm, but calm can mask deterioration when other indicators weaken. The Stochastic %K at 28.4 and %D at 50.1 show short-term momentum is lagging the broader read; %K below %D often suggests the recent bounce attempts have not yet regained control.
The clearest warning comes from MACD at 10.999 versus the signal line at 13.727, with a histogram of -2.729. MACD is a trend-following gauge, and when it sits below its signal line with a negative histogram, it means downside momentum has overtaken the prior upward impulse. This does not automatically imply a long decline, but it does tell readers that the latest price weakness is supported by internal momentum rather than being just a one-day wobble.
Volume confirms that caution. Last trade volume of 4,731,500 was only 0.8× normal versus the 20-day average of 5,652,230, while OBV is falling. On-balance volume tracks whether money is accumulating or leaving the stock; a decline there suggests that recent trading has not been led by strong buying interest. In other words, the market is not yet showing the kind of participation that usually accompanies a durable push higher.
Volatility & Volume
The ATR at 15.32, equal to 4.4% of price, says daily swings are still meaningful. For a large-cap software name, that is not trivial. Combined with the widening Bollinger bands, it means traders should expect wider intraday movement and less reliability from very tight stops. The stock is sitting at 43% of the 20-hour range between 314.15 support and 396.00 resistance, which places it closer to the lower half than the upper half of that recent corridor.
The three-month range adds context. PANW’s 3-month high of 398.88 is close to the current resistance zone, while the 3-month low of 241.00 is far below, showing the stock has recovered materially from its lower base but has not yet reclaimed the top of the recent market structure. That gap between current price and the high tells readers the stock is still working through overhead supply, meaning prior buyers near the highs may be inclined to sell into strength.
Key Levels & Scenarios
The most important short-term line is support at 314.15. If that level gives way, the chart would lose the lower boundary that has been cushioning the decline, and the case for a stable sideways pattern would weaken sharply. On the upside, resistance at 396.00 is the first major barrier, just under the 3-month high of 398.88. A move through that zone would be the cleanest sign that momentum is shifting from neutral-to-negative back toward recovery.
The current setup suggests a market that is waiting for confirmation rather than rewarding impatience. Price below the SMA20, negative MACD, falling OBV, and widening bands together argue that the path of least resistance is not yet firmly upward, even though the SMA50 at 333.95 still offers a lower structural cushion.
Technical Verdict: HOLD (wait & see)
HOLD (wait & see)
- MACD is negative with the histogram at -2.729, showing momentum has turned against the recent bounce.
- Price is below the SMA20 at 356.33, which means the stock has not yet regained its short-term trend line.
- OBV is falling and volume is 0.8× normal, so the move lacks strong participation.
Invalidation: this verdict is invalidated if price breaks and holds above 396.00 resistance, or if it falls below 314.15 support, which would shift the technical map away from neutral range trading.
- Ideal Entry Range: 333.95 to 356.33
- Exit Target (Target Price): 396.00 to 398.88
- Stop Loss protection: below 314.15
For non-traders, this means PANW is not sending a clean green or red signal yet — it is still deciding whether the next meaningful move is a recovery back toward resistance or a deeper slide toward support.
Summary Data PANW
| Last price | 349.56 USD |
| Change 1 day / 5 days / 1 month | -2.84% / -11.73% / 7.35% |
| Trend / MA-cross | sideways / none |
| SMA20 / SMA50 | 356.33 / 333.95 |
| RSI (14) / Stochastic %K | 47.9 / 28.4 |
| Bollinger %B / ATR | 43% / 15.32 |
| Support / Resistance 20 days | 314.15 / 396.00 |
| Data as of | 20 Agustus 2026 20:30 WIB |
Track PANW stock price daily: live levels, support/resistance and our full PANW analysis history.