Visa Stock Gains 0.05% Today, Testing Key Resistance
On Agustus 21, 2026: price 365.73 USD, trend uptrend, RSI 56.1, support 355.74, resistance 370.47. technical analysis of visa stock. Visa Stock Gains — full…
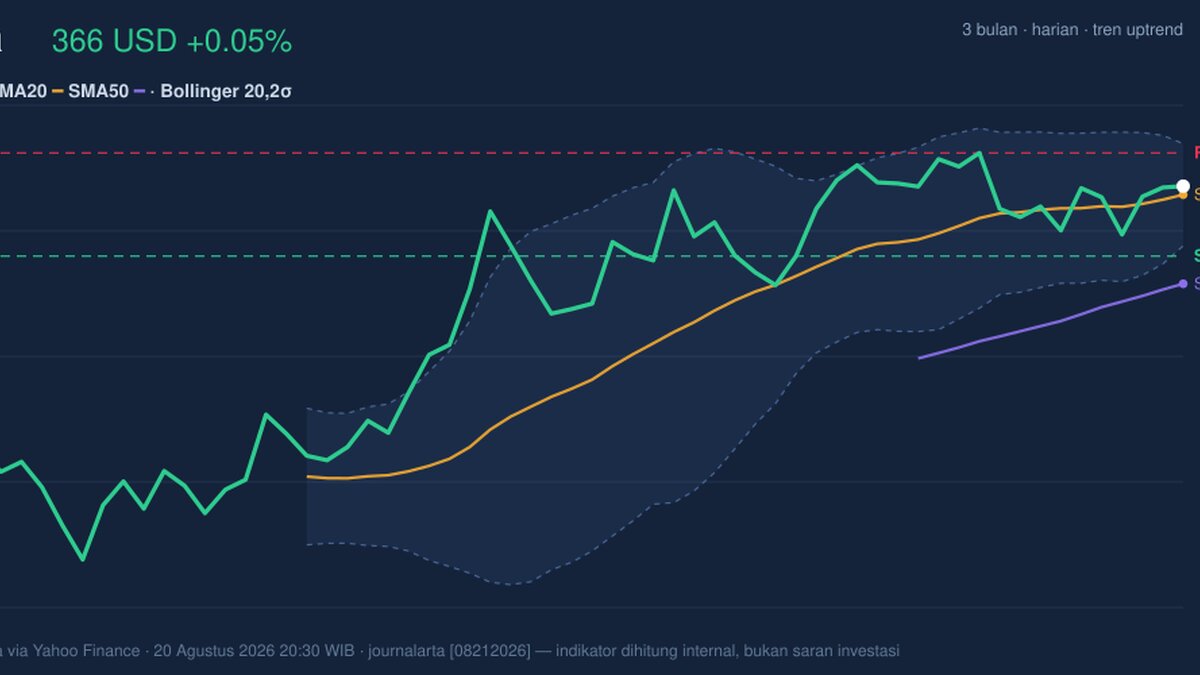
Visa’s shares were little changed at 365.73 USD in New York trading, edging up 0.05% from the previous close as the stock stayed above its short-term trend line but below the upper end of its recent range. The move is modest, yet it carries a useful signal: Visa is not correcting sharply, but it is also not showing the kind of forceful breakout that usually comes with strong participation. As shown in the chart, the shares are holding above the SMA20 at 364.51 and well above the SMA50 at 351.79, keeping the broader structure in an uptrend even as momentum has softened.
Trend & Price Action
The price structure remains constructive because Visa is still trading above the SMA20 and far above the SMA50. In plain terms, that means the stock is still being supported by both its short-term and medium-term trend, rather than slipping back into a weaker phase. The absence of a fresh MA-cross matters here: there is no new bullish crossover to signal a renewed acceleration, but there is also no bearish crossover warning that the trend has rolled over. The SMA20 slope of 0.53% over 5 days suggests the trend is still climbing, although not aggressively.
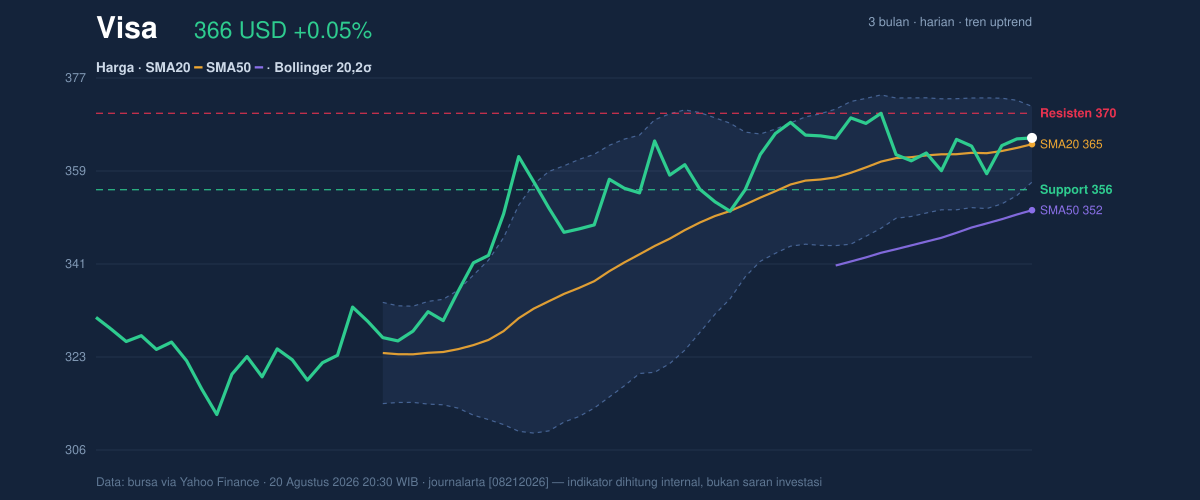
Visa is also sitting at roughly 68% of its 20-hour range, which tells readers the stock is leaning toward the upper half of its recent trading band without pressing into a clear breakout zone. The nearest ceiling is the 20-hour resistance at 370.47, while the nearest floor is the 20-hour support at 355.74. That positioning matters because it shows a market that is still firm, but not yet willing to pay up decisively beyond the recent high area. The 3-month high of 373.97 now sits just above the current range, so the stock is close enough to test it, but not close enough to claim it.
Oscillators & Momentum
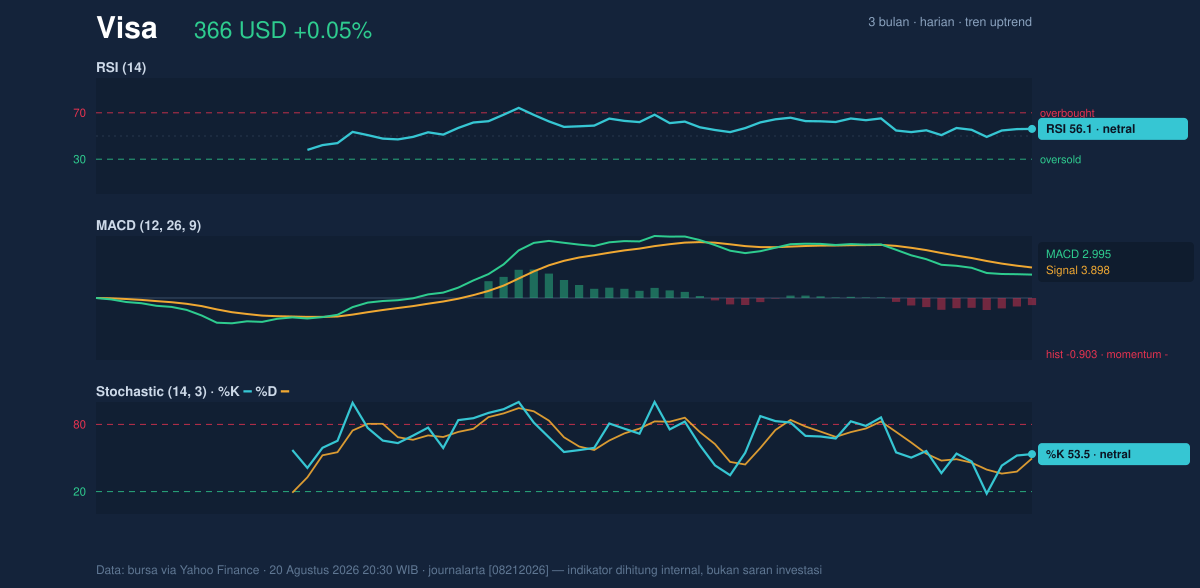
Momentum is less impressive than the trend. The RSI at 56.1 is neutral, which means the stock is neither stretched nor washed out; it is moving with mild positive bias, not with urgency. The Stochastic reading of 53.5 / 49.6 is also neutral, reinforcing the idea that price is balanced rather than overextended. This combination usually signals a market that can continue higher if buyers reappear, but it does not yet show the kind of momentum surge that would validate a fast move through resistance.
The more cautionary signal comes from MACD. Visa’s MACD at 2.995 is below the signal line at 3.898, with a histogram of -0.903. For non-specialists, that means the shorter-term trend is still lagging the recent pace of the stock, even though the broader uptrend has not broken. In practical terms, MACD is saying the advance is intact, but the engine is idling rather than accelerating. That is often what a mature trend looks like before it either consolidates or re-energizes.
Volatility & Volume
Visa’s Bollinger Bands are tightening, with the band width at 4.0%. A squeeze like this often means the market is compressing energy and may be preparing for a sharper move, though direction is not guaranteed. The current price is trading near the middle of the band, with the upper band at 371.81 and the lower band at 357.22. That placement suggests the stock is not yet stretched enough to imply immediate exhaustion, but it is also not pressing hard enough against the upper band to confirm breakout momentum.
Volume is not confirming a strong push. Last trading volume was 6,149,700, below the 20-day average of 7,266,050, or about 0.8× normal. Weak participation matters because price advances are more convincing when more shares change hands; when volume fades, rallies can lose credibility. The OBV is falling, and that is the clearest participation warning in the data. OBV, or on-balance volume, tracks whether volume is flowing into the stock on up days or away from it on down days. A declining OBV means the price is holding up better than the underlying money flow, which can leave a trend vulnerable if resistance comes into play.
ATR adds another layer. The ATR(14) at 6.53, equal to 1.8% of price, points to moderate volatility. That is important because it suggests Visa is not in a wild, unstable phase; instead, it is in a controlled environment where a move through support or resistance could still develop, but likely without extreme daily swings.
Key Levels & Scenarios
The market is now defined by a narrow but meaningful corridor. On the upside, 370.47 is the immediate resistance, followed by the 3-month high at 373.97. A clean move through that zone would tell readers the squeeze has resolved in favor of the bulls and that the stock is escaping its recent ceiling. On the downside, 355.74 is the first support to watch, and the SMA20 at 364.51 is acting as a nearby pivot. If price slips below the SMA20 and then loses 355.74, the current uptrend would look more fragile because the stock would be moving from a trend-following posture into a defensive one.
The most important signal here is not just where Visa trades, but how it behaves around those levels. A close above resistance on better volume would improve the quality of the move. A failure to hold support, especially with OBV already trending lower, would suggest the market was running on reduced conviction.
Technical Verdict: HOLD (wait & see)
HOLD (wait & see) is the clearest technical read because the trend is still positive, but momentum and volume are not yet confirming a breakout.
- Reason 1: Price remains above the SMA20 and SMA50, which keeps the broader trend constructive.
- Reason 2: MACD is negative versus its signal line, showing momentum is lagging even as price holds up.
- Reason 3: Volume is below average and OBV is falling, so participation does not yet support a decisive move.
- Verdict invalidated if price breaks below 355.74, because that would weaken the near-term structure and challenge the current uptrend.
- Ideal Entry Range: 355.74 to 364.51
- Exit Target (Target Price): 370.47 to 373.97
- Stop Loss protection: below 355.74, with the SMA50 at 351.79 as the deeper structural reference
For non-traders, this means Visa is still holding its trend, but the market has not yet proved it wants to push much higher. “We’re waiting for the next real signal, not guessing at one.”
Summary Data Visa
| Last price | 365.73 USD |
| Change 1 day / 5 days / 1 month | 0.05% / 0.08% / 4.02% |
| Trend / MA-cross | uptrend / none |
| SMA20 / SMA50 | 364.51 / 351.79 |
| RSI (14) / Stochastic %K | 56.1 / 53.5 |
| Bollinger %B / ATR | 58% / 6.53 |
| Support / Resistance 20 days | 355.74 / 370.47 |
| Data as of | 20 Agustus 2026 20:30 WIB |
Track Visa stock price daily: live levels, support/resistance and our full Visa analysis history.