XOM RSI Overbought: Stock Gains 0.84% (Agustus 21, 2026)
On Agustus 21, 2026: price 166.15 USD, trend uptrend, RSI 70.7, support 151.63, resistance 166.15. technical analysis of xom stock. XOM RSI Overbought — full…
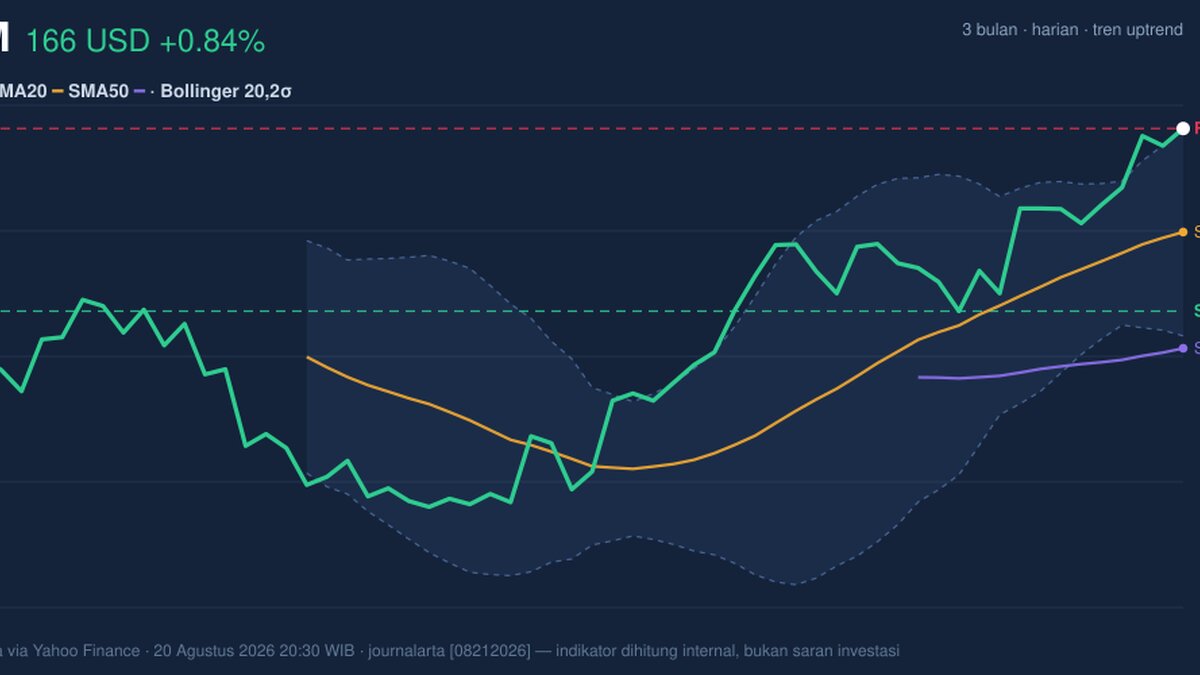
ExxonMobil’s shares on the NYSE rose to 166.15 USD on 20 August 2026, extending a short-term advance that has pushed the stock to the top of its recent trading range, according to Yahoo Finance data. The move matters because it is not just a one-day bounce: the stock is up 4.75% over five days and 5.90% over one month, a pattern that signals sustained buying rather than a single headline-driven spike. But the same chart also shows the stock pressing against its upper Bollinger Band and flashing overbought momentum, which means traders are paying up for strength while the margin for error narrows.
Trend & Price Action
The broader structure remains constructive. ExxonMobil is trading above both its SMA20 at 157.92 and SMA50 at 148.68, which tells readers the stock is not merely recovering from weakness but holding above both its short- and medium-term trend lines. The SMA20 slope of 1.91% over five days reinforces that the recent trend is still rising, and the absence of a fresh MA-cross means the current move is being carried by price strength rather than a new moving-average signal.
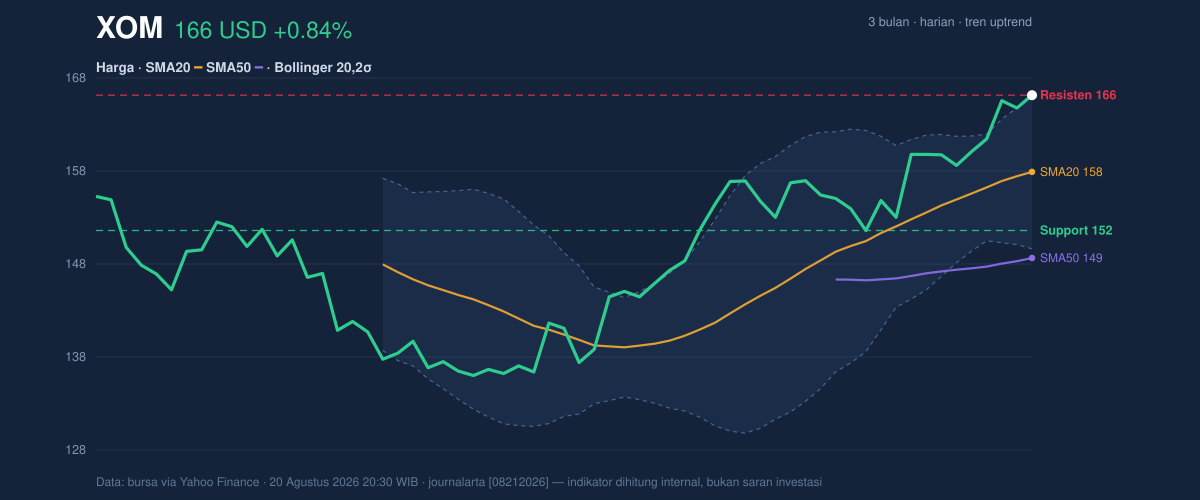
As shown in the chart, the stock is now sitting at the very edge of its range: the 20-hour resistance at 166.15 has been reached, while the 20-hour support at 151.63 remains well below. That positioning is important because a stock that closes at the top of its range often needs either fresh volume or a market-wide catalyst to continue higher; otherwise, it can stall as early buyers lock in gains. The broader three-month ceiling at 168.64 is now the next visible hurdle, and the distance between current price and that level is small enough to keep attention focused on whether the move can extend or simply pause.
Oscillators & Momentum
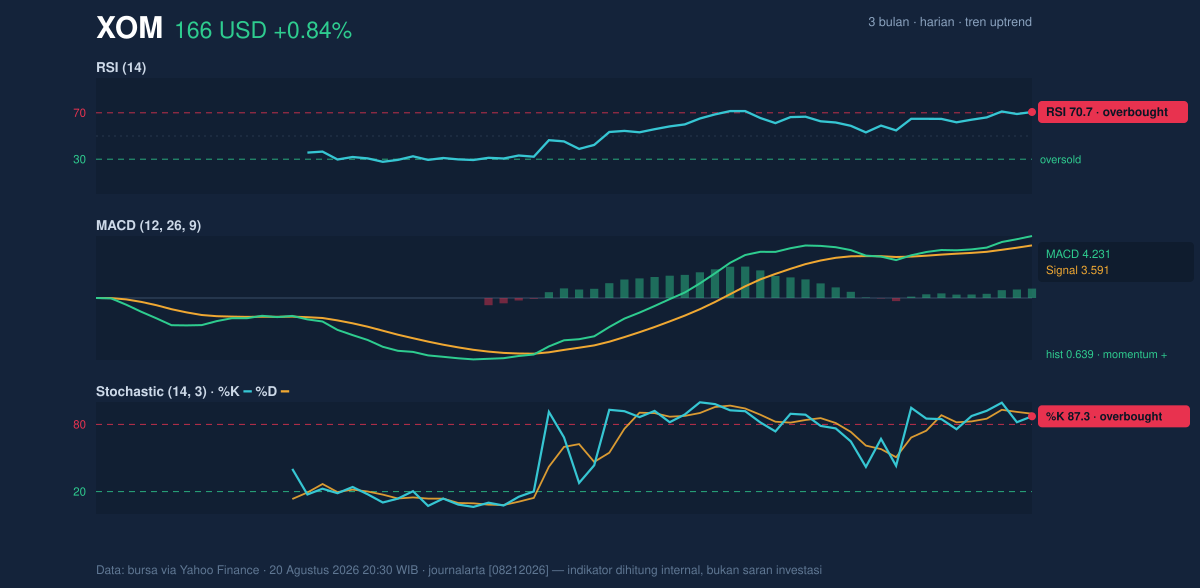
Momentum is still positive, but it is no longer subtle. The RSI at 70.7 and Stochastic %K at 87.3 / %D at 89.5 both sit in overbought territory, which usually means the stock has risen quickly enough that short-term enthusiasm is stretched. In plain English, overbought does not automatically mean a reversal is due; it means the stock may need time, not necessarily a drop, before momentum can re-accelerate.
That is where the MACD helps clarify the picture. The MACD at 4.231 remains above its signal line at 3.591, with a histogram of 0.639, showing that upward momentum is still intact. This alignment matters because it suggests the overbought reading is being driven by a real trend, not a weak rebound. Still, when RSI and Stochastic are both elevated at the same time, the market is often telling us the easy part of the move may already be behind it.
Volatility & Volume
Volatility is present, but not extreme. The ATR(14) of 3.72, equal to 2.2% of price, points to moderate daily movement, which means ExxonMobil can still swing enough to matter without looking disorderly. Bollinger Bands add another layer of context: price is effectively at the upper band, with %B at 100% and the upper band at 166.18. That is a classic sign of a stock trading at the top of its recent statistical range, often interpreted as strong momentum, but also as a zone where further upside becomes harder to sustain without consolidation.
The Bollinger Band width of 10.5% is described as normal, so this is not a volatility squeeze that is about to explode into a major breakout. Instead, the chart suggests a controlled advance that has already used up much of the near-term room between the middle band and the top band. Volume does not yet argue for a decisive breakout or breakdown: the latest 13,794,800 shares traded are roughly 1.0× normal versus the 20-day average of 14,170,380. That means participation is adequate, but not emphatic. The rising OBV, or on-balance volume, is the more encouraging clue, because it indicates accumulated buying pressure has been building underneath the price action even if the latest session was not unusually heavy.
Key Levels & Scenarios
The market is now defined by a tight set of levels. Immediate support is the 151.63 zone, where the recent range begins. Above price, the first resistance is the current 166.15 area, followed by the 168.64 three-month high. Because price is already at 100% of the 20-hour range, the chart is telling us that upside continuation would need to be earned, not assumed.
If ExxonMobil holds above the current band and volume improves, the market could attempt a test of the 168.64 high. If it fails to hold the upper range, the more likely near-term behavior is a pullback toward the 157.92 SMA20, which now acts as the first meaningful trend reference. A deeper failure below that would put the 151.63 support back in focus, where the recent advance would be judged as either a pause or a false breakout.
Technical Verdict: HOLD (wait & see)
HOLD (wait & see)
- RSI at 70.7 and Stochastic %K/%D at 87.3/89.5 show the stock is overbought, so upside exists but is stretched.
- MACD above signal and a positive 0.639 histogram confirm the trend is still upward, so momentum has not broken.
- Price at 166.15 is sitting on the upper Bollinger Band at 166.18 and at 100% of the 20-hour range, which often calls for patience rather than chasing.
- Verdict invalidated if price falls below 151.63, the 20-hour support.
- Ideal Entry Range: 157.92 to 151.63
- Exit Target: 168.64
- Stop Loss Protection: below 151.63
In plain English, the stock is still strong, but it is already stretched enough that the next move may be a pause before any further climb.
The next technical checkpoint is whether ExxonMobil can hold 166.15 and challenge the 168.64 three-month high.
Summary Data XOM
| Last price | 166.15 USD |
| Change 1 day / 5 days / 1 month | 0.84% / 4.75% / 5.90% |
| Trend / MA-cross | uptrend / none |
| SMA20 / SMA50 | 157.92 / 148.68 |
| RSI (14) / Stochastic %K | 70.7 / 87.3 |
| Bollinger %B / ATR | 100% / 3.72 |
| Support / Resistance 20 days | 151.63 / 166.15 |
| Data as of | 20 Agustus 2026 20:30 WIB |
Track XOM stock price daily: live levels, support/resistance and our full XOM analysis history.