BP Testing Key Resistance: Stock Drops 0.49% (Agustus 24, 2026)
On Agustus 24, 2026: price 549.50 GBp, trend sideways, RSI 59.8, support 514.90, resistance 552.50. technical analysis of bp stock. BP Testing Key Resistance —…
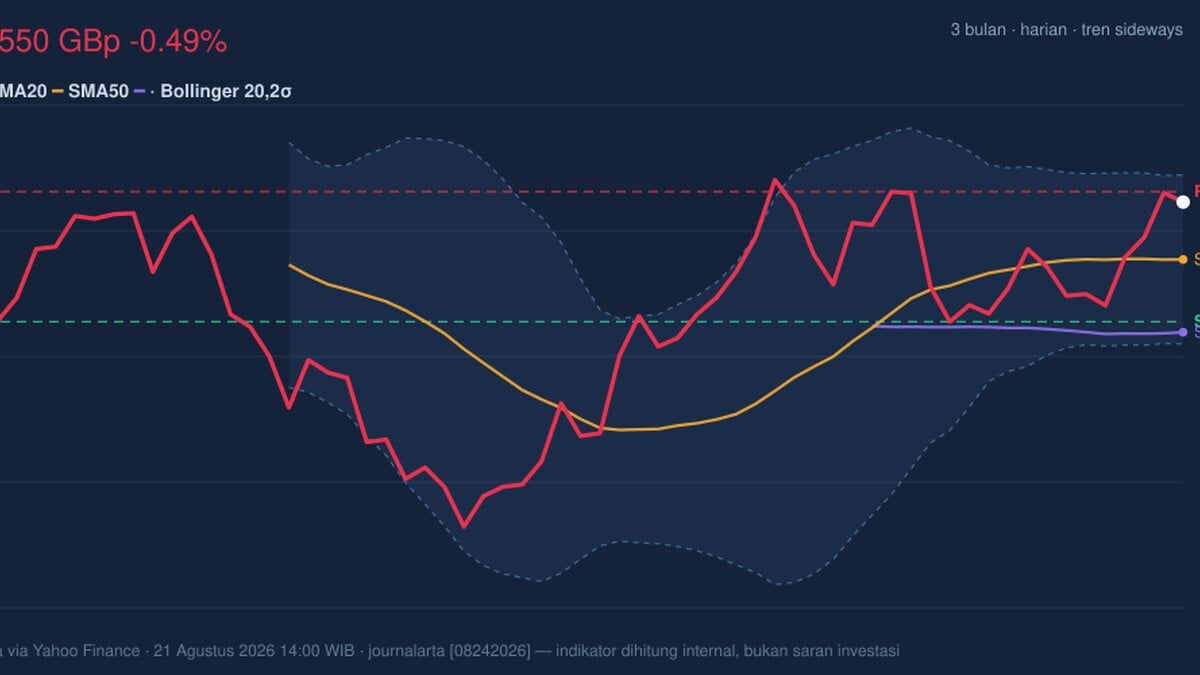
BP plc is pressing against the upper end of its recent trading band, and that matters for global investors because the next move is less about the oil major’s story than about whether momentum can keep the shares above nearby resistance. The London-listed stock last changed hands at 549.50 GBp, down 0.49% on the day after a 5.09% gain over five days, according to data from the London market via Yahoo Finance on 21 August 2026 at 14:00 WIB.
Trend & Price Action
The chart shows BP still in a broad sideways trend, but with a constructive lean. Price remains above the SMA20 at 532.92 and above the SMA50 at 511.86, which tells readers that the medium-term base is still intact even though the slope of the SMA20 is only -0.01% over five days. That tiny downward tilt is important: it says the stock is not in a clean breakout trend, but neither is it losing its footing decisively.
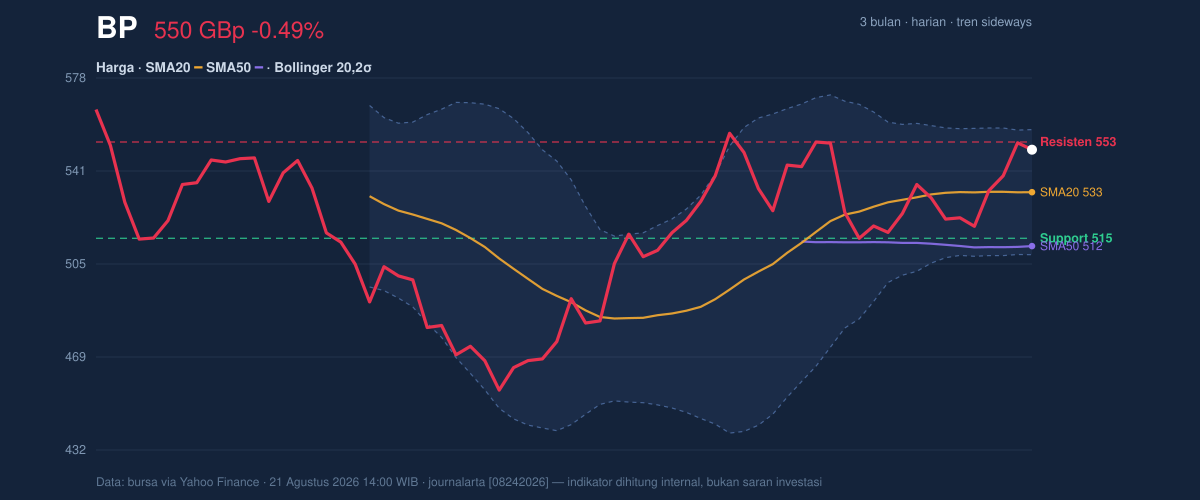
The absence of a fresh MA cross matters too. A new moving-average crossover often marks a change in regime; here, there is no such signal, so the market is still digesting its recent gains rather than confirming a new directional phase. With price sitting at about 92% of the 20-hour range, BP is trading close to the top of the session structure, which increases the chance of either a test of resistance or a pause.
The key near-term ceiling is 552.50, just above the last price and aligned with the recent range high. Above that, the broader chart points to the 570.70 three-month high as the next visible reference. On the downside, 514.90 is the first support that matters; it is the level where buyers have recently been active enough to define the lower edge of the range.
Oscillators & Momentum
Momentum is supportive, but not stretched enough to suggest an obvious exhaustion signal. The RSI at 59.8 is neutral, which means BP is not overbought in the classic sense even after the recent rise. That leaves room for further gains if buyers stay engaged, but it also shows the move is not yet strong enough to call it a momentum breakout.
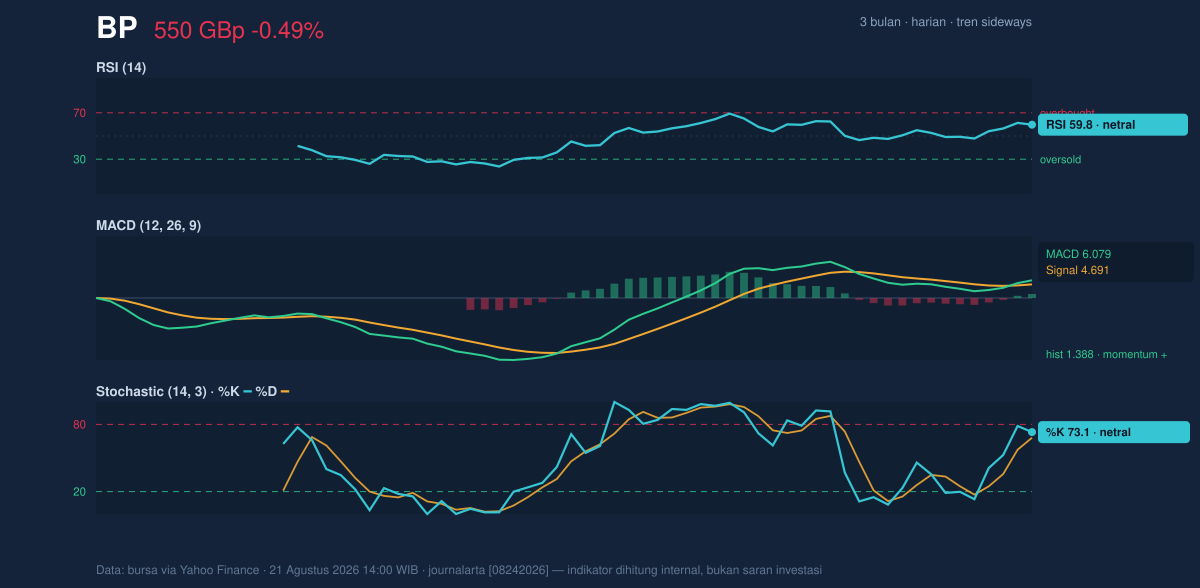
The Stochastic at 73.1 / 68.1 sits in neutral territory, though it is leaning toward the upper part of its band. In plain English, that usually means the share price is closer to the recent highs than the recent lows, but without the kind of extreme reading that often precedes an immediate reversal. The more important signal here is the MACD at 6.079 above the signal line at 4.691, with a positive histogram of 1.388. That combination indicates upward momentum is still in place, because the faster trend measure remains ahead of the slower one.
Taken together, the oscillators do not shout “overextended.” They suggest BP has room to probe higher, but the market is still waiting for confirmation that the recent advance can extend beyond the current band.
Volatility & Volume
Volatility is neither compressed enough to imply a major breakout setup nor elevated enough to suggest panic. The Bollinger Bands are relatively normal, with a 9.2% width, and price is trading at a %B of 84%. That means BP is near the upper band at 557.35, but not touching it aggressively. In practical terms, the stock is close to the top of its expected trading envelope, which often leads to either a short pause or a push through the band if buying pressure persists.
The ATR at 14.26, equal to 2.6% of price, points to moderate day-to-day movement. This is a useful signal because it suggests stops and targets do not need to be set for extreme swings; the market is moving, but not violently.
Volume adds a subtle confirmation. Last session’s volume of 54,092,424 was just above the 20-day average of 52,872,661, or about 1.0x normal. That is not a surge, but it does show participation has not dried up. More importantly, OBV is rising, which means volume flow has been broadly supportive of the price advance rather than diverging against it. When OBV rises alongside price, it often signals that the move is being backed by accumulation rather than a thin, short-lived drift.
Key Levels & Scenarios
The market is boxed in by a fairly clear near-term band. On the upside, 552.50 is the first test, followed by the 557.35 upper Bollinger band. If BP can clear that zone with conviction, the chart opens room toward the 570.70 three-month high. On the downside, 532.92 is the middle Bollinger/SMA20 area and the first place where a soft pullback may find support; below that, 514.90 is the more important floor, with 508.49 marking the lower Bollinger band.
The signal to watch is simple: if price holds above the mid-band and keeps MACD positive, the market is still treating dips as pauses. If it slips back below the support cluster, the tone changes from consolidation to retracement.
Technical Verdict: HOLD (wait & see)
HOLD (wait & see) is the cleanest technical reading because BP is constructive, but not yet decisive enough to call a trend break.
- Reason 1: Price is above the SMA20 and SMA50, which supports the broader structure.
- Reason 2: MACD is positive and the histogram remains above zero, showing momentum is still aligned with the upside.
- Reason 3: RSI and Stochastic are neutral, so the stock is not overbought, but neither is it flashing a strong breakout signal.
- Verdict invalidated if price falls below 514.90, because that would weaken the current range floor and undermine the constructive setup.
- Ideal Entry Range: 532.92 to 514.90
- Exit Target: 557.35, then 570.70
- Stop Loss protection: 508.49
In plain English: BP looks steady and slightly constructive, but the chart still needs a clearer push through resistance before the next leg higher is confirmed.
The next technical checkpoint is whether the shares can close above 552.50 and stay there into the next session.
Summary Data BP
| Last price | 549.50 GBp |
| Change 1 day / 5 days / 1 month | -0.49% / 5.09% / 0.20% |
| Trend / MA-cross | sideways / none |
| SMA20 / SMA50 | 532.92 / 511.86 |
| RSI (14) / Stochastic %K | 59.8 / 73.1 |
| Bollinger %B / ATR | 84% / 14.26 |
| Support / Resistance 20 days | 514.90 / 552.50 |
| Data as of | 21 Agustus 2026 14:00 WIB |
Track BP share price daily: live levels, support/resistance and our full BP analysis history.