VZ Stock Technicals: Drops 0.46% on Wednesday, Death Cross Pressure
On October 7, 2026: price 45.77 USD, trend downtrend, RSI 34.6, support 45.77, resistance 51.45. technical analysis of vz stock. VZ Stock Technicals — full…
Trend & Price Action
Verizon traded below both its 20-day simple moving average (SMA) of $47.63 and its 50-day average of $48.23. The 20-day average has fallen 2.22% over five trading days and crossed below the 50-day average—a death cross, a signal that shorter-term price weakness has overtaken the longer trend measured by those averages. It does not predict how far a decline may go, but it makes a sustained recovery harder to establish without the price reclaiming those levels. The share price is at the bottom of its 20-day range, with support at $45.77 and resistance at $51.45. That is a notably weak position, though the three-month low of $41.34 shows the stock has traded lower before. As shown in the chart, the gap between the current price and the moving averages frames the first test for any rebound.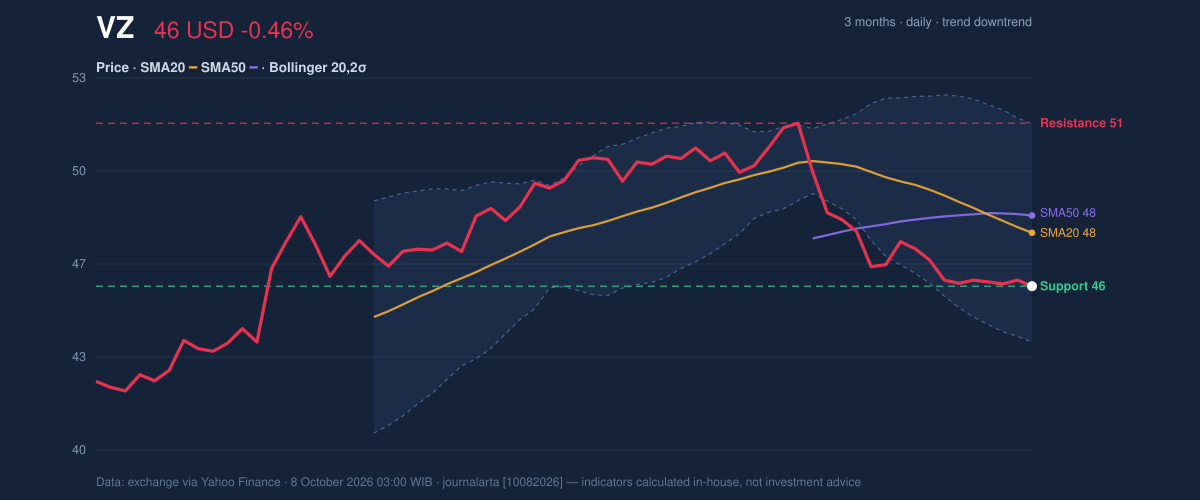
Oscillators & Momentum
Momentum indicators are weak, but they do not all say the same thing. The RSI is 34.6, a reading that indicates subdued momentum without reaching the conventional oversold threshold. By contrast, the Stochastic is oversold, with %K at 15.7 and %D at 12.3. Oversold readings can precede a bounce, but they are not proof that a decline has ended; they can persist while a stock remains under pressure. The MACD is negative at -0.829, below its -0.610 signal line, with a negative histogram of -0.219. In plain terms, the recent downward momentum has not yet turned upward. That divergence from the oversold Stochastic matters: one indicator suggests selling may be stretched, while MACD still confirms a bearish trend.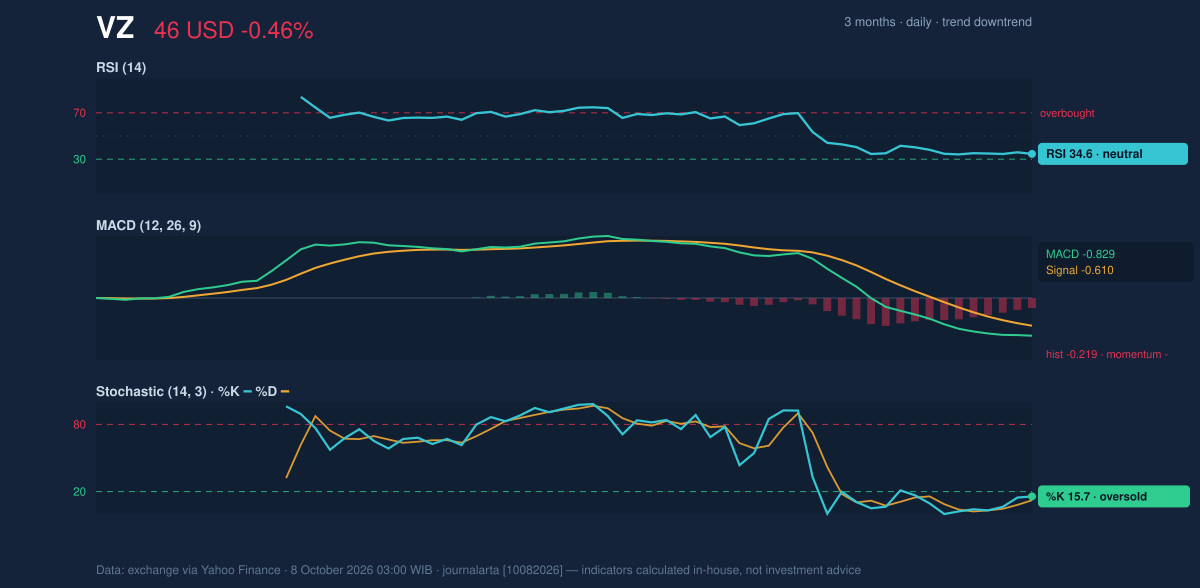
Volatility & Volume
Verizon’s Bollinger Bands are at normal width, rather than unusually tight or expanding sharply. The price sits in the lower part of the band, with %B at 26% and the lower band at $43.83. This places the stock closer to the band’s lower edge than its upper boundary, but does not by itself establish a floor. The average true range is $0.82, or 1.8% of the share price, pointing to moderate day-to-day volatility. Trading volume was 15,876,300 shares, about 0.7 times the 20-day average of 21,820,505. OBV, a running measure that uses volume to track buying and selling pressure, is falling. The light turnover means the latest decline did not attract unusually heavy trading, but the weakening OBV offers little evidence that buyers are accumulating shares.Key Levels & Scenarios
The immediate question is whether Verizon can hold $45.77, the reported 20-day support and current price. A failure to hold that level would put the lower Bollinger Band at $43.83 in focus; a break there would move attention toward the three-month low of $41.34. On the upside, a recovery would first need to contend with the 20-day average at $47.63, then the 50-day average at $48.23. The 20-day resistance at $51.45 is a more distant hurdle, close to the three-month high of $51.67. The technical picture remains bearish, with oversold conditions offering a possible pause but not yet a confirmed reversal.Technical Verdict: HOLD
The indicators support a cautious, wait-and-see reading rather than a decisive directional signal: - The death cross and falling SMA20 point to a weakening trend. - Negative MACD and falling OBV show that momentum and volume pressure have not turned. - Oversold Stochastic readings may allow a rebound, while price at support makes a breakdown risk material. The verdict is invalidated if the price falls below $43.83, the lower Bollinger Band. - Ideal Entry Range: $43.83–$45.77, based on the lower Bollinger Band and 20-day support. - Exit Target: $47.63–$48.23, the SMA20-to-SMA50 resistance zone. - Stop Loss: Below $43.83, using the lower Bollinger Band as the defined risk threshold. For non-traders, HOLD means the chart has not yet shown enough evidence to resolve whether support will hold or the downtrend will deepen.Data: Exchange market data via Yahoo Finance, as of October 8, 2026, 03:00 WIB.
Why VZ is in focus today
- Closed at a 20-day low (45.77)
- Fresh death cross: SMA20 crossed below SMA50
Selected automatically from 30 NYSE (US) stocks by a technical-signal score with daily weighted randomisation — not a recommendation.
Summary Data VZ
| Last price | 45.77 USD |
| Change 1 day / 5 days / 1 month | -0.46% / -0.22% / -7.98% |
| Trend / MA-cross | downtrend / death |
| SMA20 / SMA50 | 47.63 / 48.23 |
| RSI (14) / Stochastic %K | 34.6 / 15.7 |
| Bollinger %B / ATR | 26% / 0.82 |
| Support / Resistance 20 days | 45.77 / 51.45 |
| Data as of | 8 October 2026 03:00 WIB |
Disclaimer: This technical analysis is generated automatically from exchange data (via Yahoo Finance) and indicators calculated by JournalArta, for information and education only. The verdict and the entry, target and stop-loss levels are not investment advice or a solicitation to buy or sell any security. Investment decisions and their risks rest solely with the reader.
Track VZ stock price daily: live levels, support/resistance and our full VZ analysis history.