MCD Stock Drops 0.68% on Wednesday, RSI Oversold
On October 7, 2026: price 230.88 USD, trend downtrend, RSI 24.3, support 230.88, resistance 257.49. technical analysis of mcd stock. MCD Stock Drops — full…
Trend & Price Action
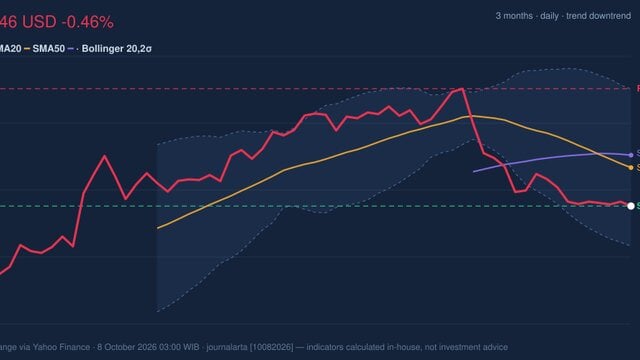
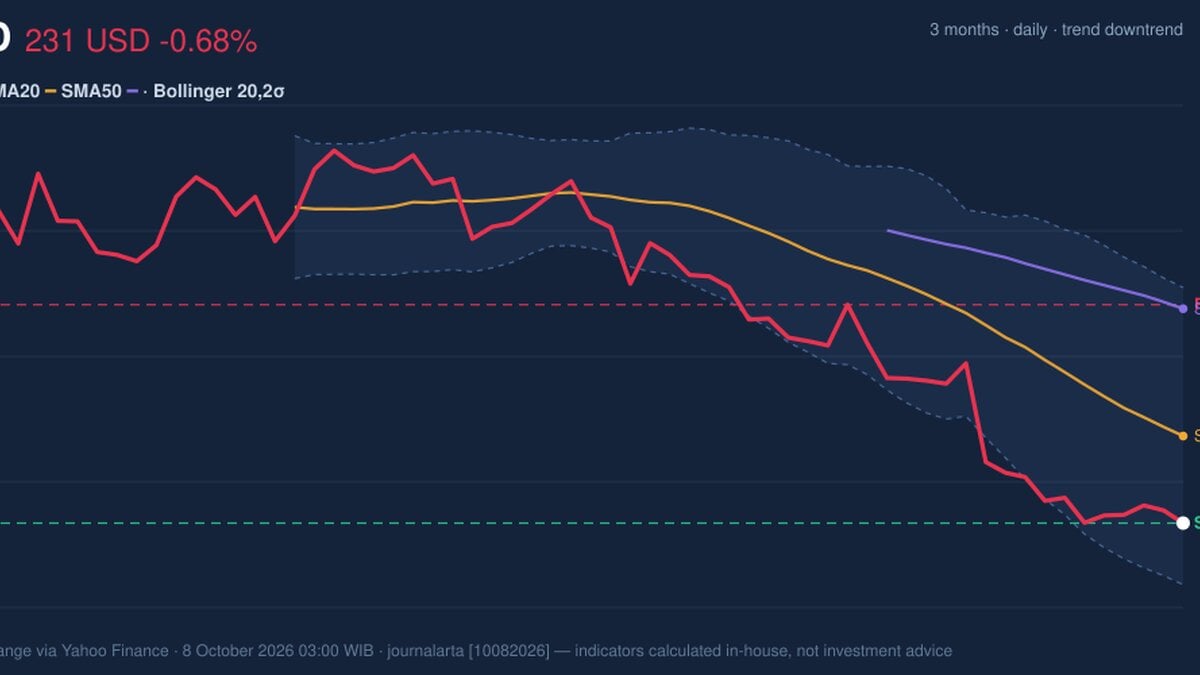
The decline is more than a one-day move: McDonald’s has fallen 8.92% over the past month, while its 20-day moving average is sloping down 2.53% over five trading days. At $230.88, the stock sits well below the 20-day average of $241.49 and the 50-day average of $257.01. That separation points to a persistent downtrend; neither average has recently crossed the other, so there is no fresh moving-average signal suggesting the trend has turned. The stock is pressing against its 20-day support at $230.88, at the bottom of the reported 20-day range. Its three-month low of $229.20 is only slightly lower. This proximity makes the area important: holding it could provide a base for a short-term recovery, while a break beneath it would mean the recent low has failed to contain selling. As shown in the chart, the price remains below the moving averages and near the lower Bollinger band.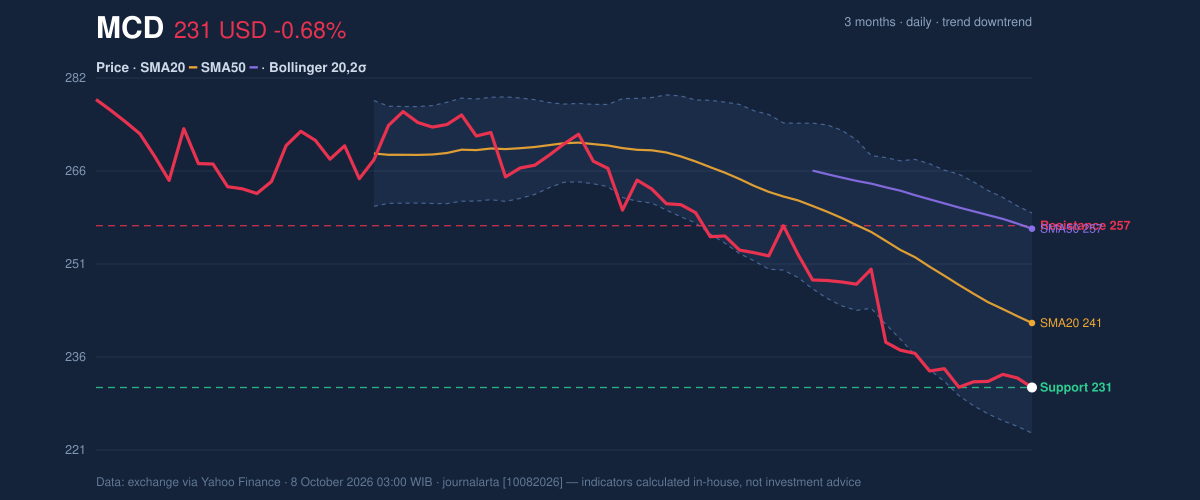
Oscillators & Momentum
Momentum readings show how stretched the decline has become, but they do not yet show a reversal. The RSI at 24.3 is oversold, and the Stochastic readings—%K at 7.3 and %D at 12.5—are also in oversold territory. These indicators compare recent price moves with their past range; low readings can accompany a bounce, but they can remain low while a downtrend continues. The MACD reinforces that caution. Its reading of -7.802 is below the signal line at -7.583, and the -0.218 histogram remains negative. In plain terms, downward momentum is still dominant, even as the oversold readings suggest the decline may be due for a pause. A sustained improvement in momentum would be more persuasive than oversold status alone.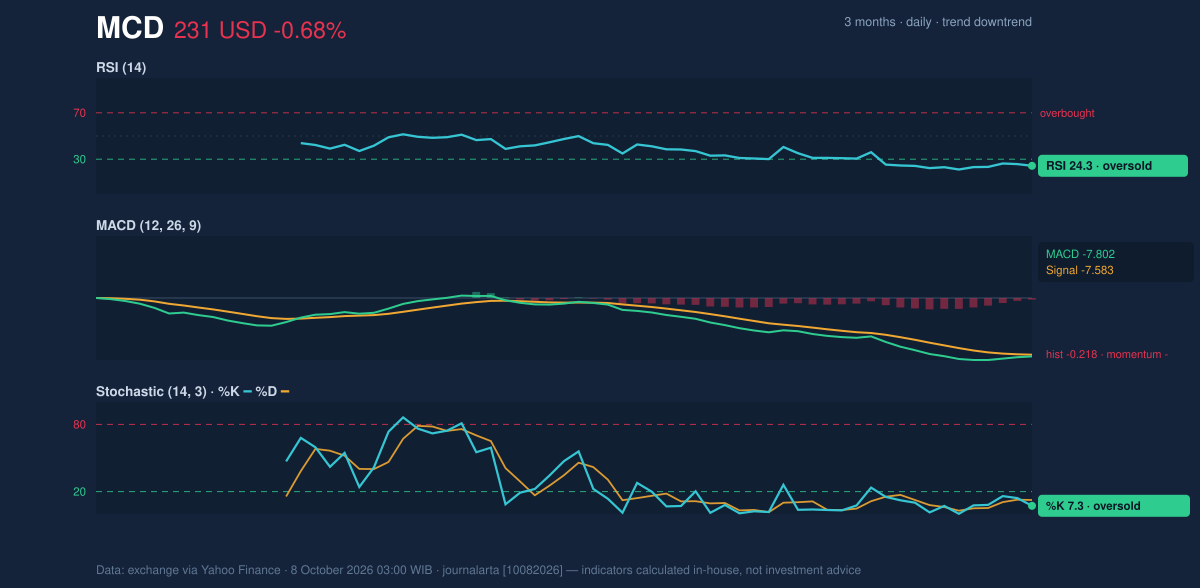
Volatility & Volume
McDonald’s sits near the lower Bollinger band at $223.39, with the band’s midpoint at $241.49 and upper boundary at $259.59. The %B reading of 21% places the price in the lower portion of the band, consistent with weakness. But the 15.0% band width is classified as normal, not unusually narrow or wide; the data therefore offer no clear squeeze signal for an impending sharp move. The average true range is $4.50, or 1.9% of the share price, indicating moderate day-to-day volatility. Trading volume was 4,652,400 shares, about 0.7 times the 20-day average of 6,267,330, while on-balance volume was falling. The lighter turnover means the latest drop did not come with above-average participation, but declining OBV—an indicator that tracks whether volume is more associated with buying or selling—still points to distribution rather than accumulation.Key Levels & Scenarios
The immediate test is the $230.88 20-day support, with the $229.20 three-month low just below it. If both levels hold, oversold RSI and Stochastic readings leave room for a technical rebound toward the $241.49 20-day average. A recovery would still face a more substantial barrier at the $257.49 20-day resistance, near the 50-day average at $257.01. If price falls below $229.20, the current support area would have failed; the supplied data do not establish a lower support level. Conversely, a move above $241.49 would ease immediate pressure, but would not erase the downtrend while the stock remains below its 50-day average.Technical Verdict: HOLD (wait & see)
The HOLD (wait & see) verdict reflects three signals: the price is below declining 20-day and 50-day averages; MACD remains negative; and oversold RSI and Stochastic readings raise the possibility of a bounce without confirming one. The verdict is invalidated if price falls below $229.20, the three-month low. - Ideal entry range: $229.20–$230.88, the three-month low and 20-day support area. - Exit target: $241.49, the 20-day average; $257.49 is the next stated resistance. - Stop-loss protection: Below $229.20, where the identified three-month floor would give way. For non-traders, the indicators show a weak trend that is stretched enough to merit caution, but not yet strong enough to confirm a recovery.Data table — MCD, NYSE (Yahoo Finance, as of October 8, 2026, 03:00 WIB)
Why MCD is in focus today
- Closed at a 20-day low (230.88)
- Trading near its 3-month low (229.20)
- RSI(14) at 24.3 — oversold zone
- Not covered by JournalArta in the last 14 days
Selected automatically from 30 NYSE (US) stocks by a technical-signal score with daily weighted randomisation — not a recommendation.
| Indicator | Reading |
|---|---|
| Last price / previous close | $230.88 / $232.45 |
| Change | 1 day: -0.68%; 5 days: -0.03%; 1 month: -8.92% |
| SMA20 / SMA50 | $241.49 / $257.01 |
| Bollinger bands (upper / middle / lower) | $259.59 / $241.49 / $223.39 |
| RSI / Stochastic | 24.3 / %K 7.3, %D 12.5 |
| MACD / signal / histogram | -7.802 / -7.583 / -0.218 |
| ATR / volume | $4.50 / 4,652,400 |
| Support / resistance | $230.88 / $257.49 |
| Three-month high / low | $281.62 / $229.20 |
Summary Data MCD
| Last price | 230.88 USD |
| Change 1 day / 5 days / 1 month | -0.68% / -0.03% / -8.92% |
| Trend / MA-cross | downtrend / none |
| SMA20 / SMA50 | 241.49 / 257.01 |
| RSI (14) / Stochastic %K | 24.3 / 7.3 |
| Bollinger %B / ATR | 21% / 4.50 |
| Support / Resistance 20 days | 230.88 / 257.49 |
| Data as of | 8 October 2026 03:00 WIB |
Disclaimer: This technical analysis is generated automatically from exchange data (via Yahoo Finance) and indicators calculated by JournalArta, for information and education only. The verdict and the entry, target and stop-loss levels are not investment advice or a solicitation to buy or sell any security. Investment decisions and their risks rest solely with the reader.
Track MCD stock price daily: live levels, support/resistance and our full MCD analysis history.