Momentum Gains, WMT Stock Gains 0.90% on Wednesday
On October 7, 2026: price 108.16 USD, trend sideways, RSI 52.9, support 103.92, resistance 110.53. technical analysis of wmt stock. Momentum Gains — full…
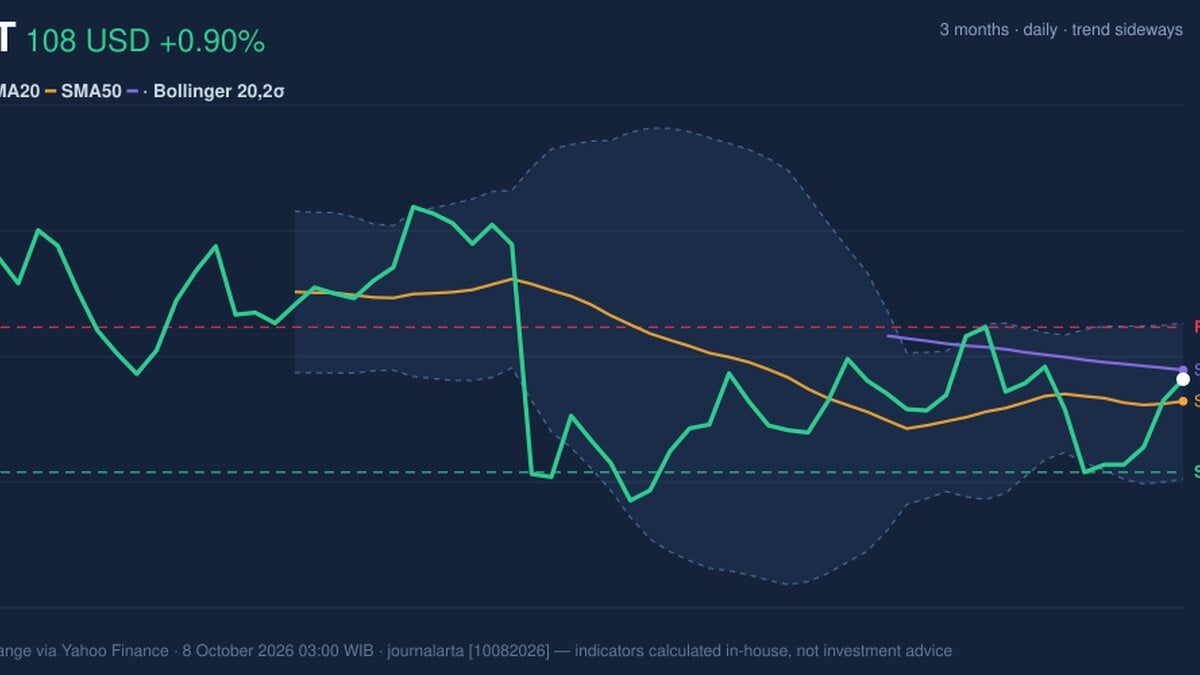
Trend & Price Action
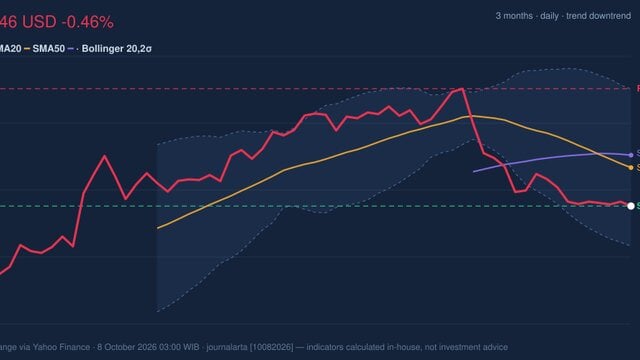
The stock gained 4.08% over five trading days and 2.20% over one month, but its broader trend remains sideways. At $108.16, Walmart is above its SMA20, the average closing price over the past 20 sessions, at $107.16, but just below its SMA50 at $108.57. The SMA20’s slight decline—0.21% over five days—suggests that the short-term trend has not yet turned decisively upward. There is no new moving-average crossover to confirm a change in direction. The price sits about 64% of the way through its 20-day range, between support at $103.92 and resistance at $110.53. That positioning puts it closer to resistance than support, but still inside the established band. As shown in the chart, the nearby averages and resistance line are key tests for whether the latest gain can extend.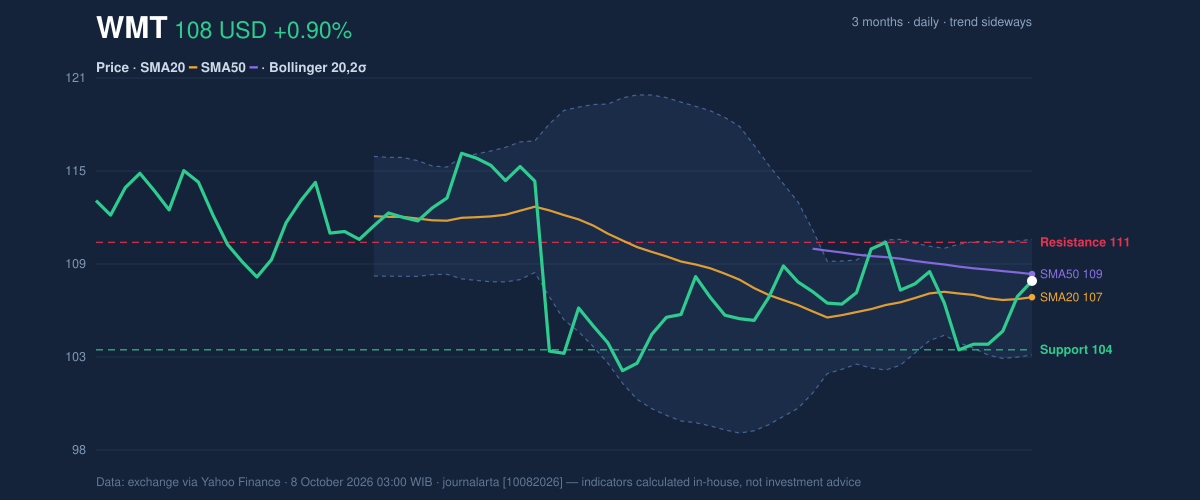
Oscillators & Momentum
The MACD histogram has just turned positive at 0.068, as the MACD reading of -0.527 moves above its signal line at -0.594. That is an early sign that downward momentum is easing; because both readings remain below zero, it is not yet confirmation of a strong upward trend. The change is the clearest fresh signal in the data. RSI is neutral at 52.9, while the Stochastic readings—%K at 60.8 and %D at 43.6—also remain in neutral territory. These measures track the pace of recent price moves: neither currently indicates an especially stretched rally or a deeply oversold decline. Their restraint fits the sideways price structure rather than contradicting it.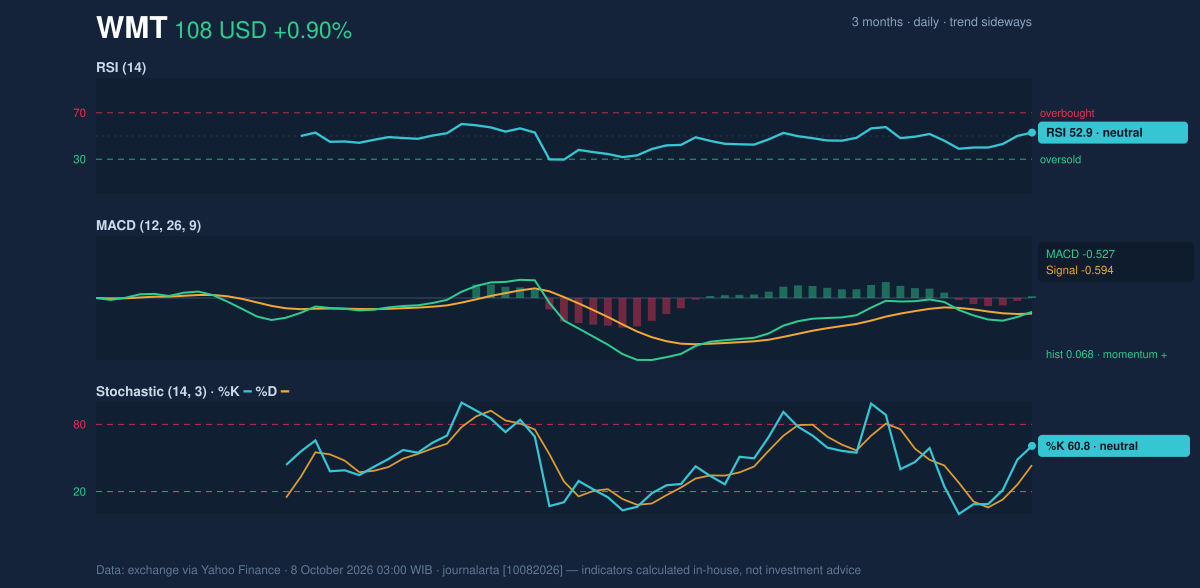
Volatility & Volume
The Bollinger Bands are narrowing: the band width is 6.6%, with price at 64% of the range between the upper and lower bands. A squeeze—narrowing bands that often precede a larger move—signals that volatility has contracted, not that a breakout is guaranteed. The upper band at $110.72 is close to the 20-day resistance at $110.53, making that area a significant test. The lower band at $103.60 is near support. Average true range, a measure of typical price movement, is $2.21, or 2.0% of the share price, indicating moderate volatility. Volume was 16.1 million shares, about 0.7 times its 20-session average of 22.3 million. That thinner participation tempers the force of the recent advance, although OBV—a running measure of volume flowing into or out of a stock—has risen. The combination suggests accumulation may be present, but the latest session lacked the volume normally sought for stronger confirmation.Key Levels & Scenarios
A sustained move above $110.53 would clear 20-day resistance and bring the upper Bollinger Band at $110.72 into focus. Failure there would leave the share price within its sideways range. On the downside, a break below $103.92 would put the lower band at $103.60 in view; the three-month low is $102.15. These are conditional markers, not predictions.Technical Verdict: HOLD (wait & see)
HOLD (wait & see) reflects mixed evidence: the positive MACD histogram and price above SMA20 are constructive, but the price remains below SMA50 and volume is thin. Neutral RSI and Stochastic readings offer no strong momentum confirmation. The verdict is invalidated if price falls below $103.92, the stated 20-day support. - Ideal entry range: $107.16–$108.57, bounded by SMA20 and SMA50. - Exit target: $110.53–$110.72, covering 20-day resistance and the upper Bollinger Band. - Stop-loss protection: below $103.60, the lower Bollinger Band. In plain English, the indicators show a tentative improvement, but not enough confirmation to resolve Walmart’s sideways trend.Data table — Walmart (WMT), NYSE
Why WMT is in focus today
- MACD histogram has just turned positive
Selected automatically from 30 NYSE (US) stocks by a technical-signal score with daily weighted randomisation — not a recommendation.
| Last price | $108.16 |
| Daily change | +0.90% |
| 5-day / 1-month change | +4.08% / +2.20% |
| SMA20 / SMA50 | $107.16 / $108.57 |
| RSI(14) | 52.9 (neutral) |
| MACD / signal / histogram | -0.527 / -0.594 / +0.068 |
| 20-day support / resistance | $103.92 / $110.53 |
| Volume / 20-session average | 16,131,900 / 22,270,125 |
| Source | Exchange data via Yahoo Finance, as of 8 October 2026, 03:00 WIB |
Summary Data WMT
| Last price | 108.16 USD |
| Change 1 day / 5 days / 1 month | 0.90% / 4.08% / 2.20% |
| Trend / MA-cross | sideways / none |
| SMA20 / SMA50 | 107.16 / 108.57 |
| RSI (14) / Stochastic %K | 52.9 / 60.8 |
| Bollinger %B / ATR | 64% / 2.21 |
| Support / Resistance 20 days | 103.92 / 110.53 |
| Data as of | 8 October 2026 03:00 WIB |
Disclaimer: This technical analysis is generated automatically from exchange data (via Yahoo Finance) and indicators calculated by JournalArta, for information and education only. The verdict and the entry, target and stop-loss levels are not investment advice or a solicitation to buy or sell any security. Investment decisions and their risks rest solely with the reader.
Track WMT stock price daily: live levels, support/resistance and our full WMT analysis history.