CAT Stock Analysis: Drops 5.75%, Momentum Gains
On October 7, 2026: price 813.83 USD, trend sideways, RSI 47.3, support 782.72, resistance 863.44. technical analysis of cat stock. CAT Stock Analysis — full…
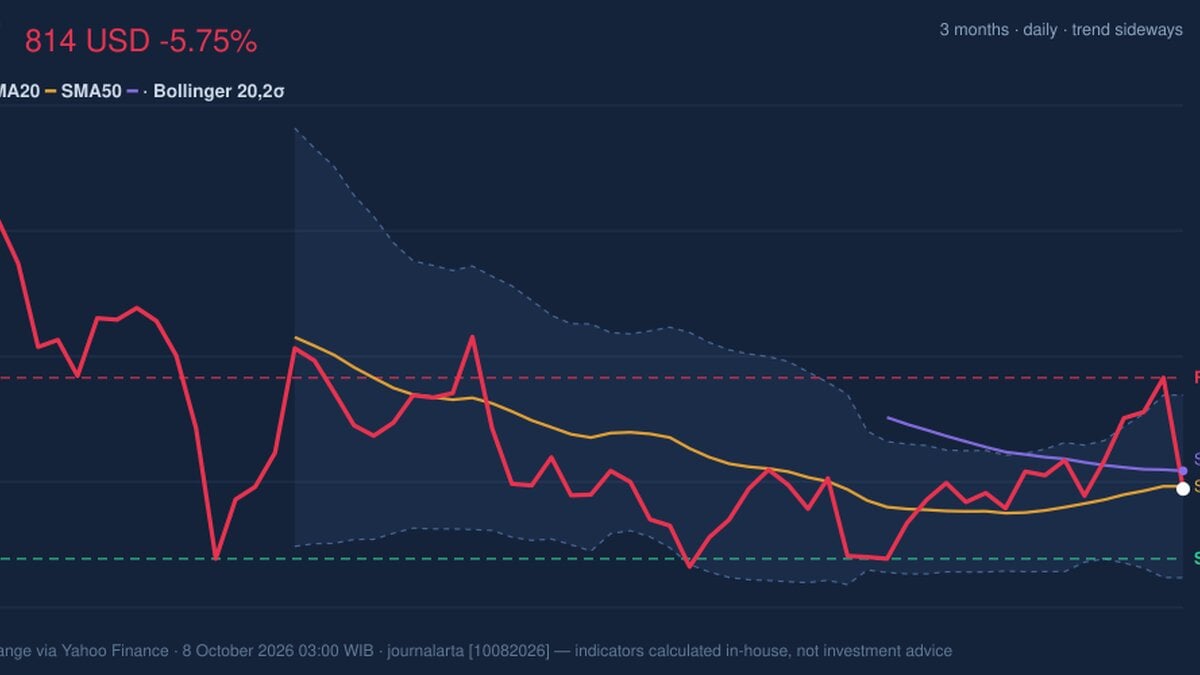
Why CAT is in focus today
- One-day move of -5.75%, about 1.9× its average daily range (ATR)
- Not covered by JournalArta in the last 14 days
Selected automatically from 30 NYSE (US) stocks by a technical-signal score with daily weighted randomisation — not a recommendation.
Trend & Price Action
CAT’s broader pattern remains sideways. The shares are below the 20-day simple moving average (SMA) of $814.97 and the 50-day SMA of $821.90, but the 20-day average has risen 0.95% over five trading days. There is no recent crossover between the averages, so the data do not establish a fresh trend in either direction. The gap below both averages signals near-term weakness, while the rising short-term average suggests that momentum had been improving before the latest drop. The stock is at 39% of its 20-day range, between support at $782.72 and resistance at $863.44. It is also closer to its three-month low of $771.39 than its high of $983.16. The range position shows that the sharp fall has moved CAT away from the middle of its recent trading band, but it has not yet breached the identified support. The key question is whether the drop becomes a breakdown or a test of support.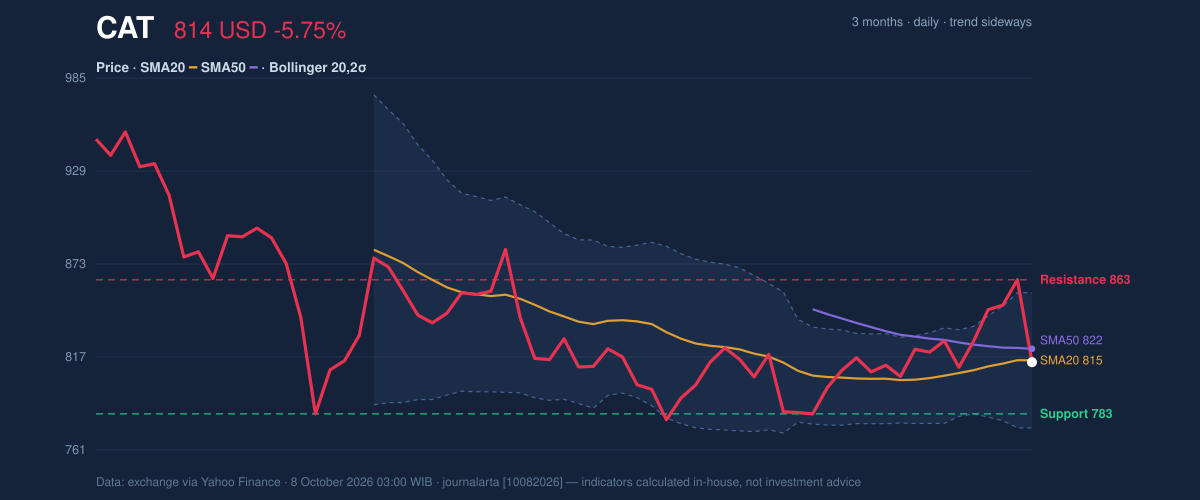
Oscillators & Momentum
The momentum indicators offer a mixed reading rather than a clear reversal signal. The RSI is neutral at 47.3, near the midpoint of its scale; it neither indicates an oversold market nor strong buying pressure. The Stochastic is also classified as neutral, with %K at 23.7 and %D at 64.9. The gap between the two lines points to weaker short-term momentum, although the stated classification does not confirm an oversold condition. By contrast, MACD momentum remains positive: its reading is 4.534, above a 0.095 signal line, leaving a positive histogram of 4.439. MACD compares shorter- and longer-term price momentum; a positive reading can indicate underlying upward pressure, but it does not erase the latest decline. The divergence between positive MACD and a price below both moving averages means confirmation is lacking.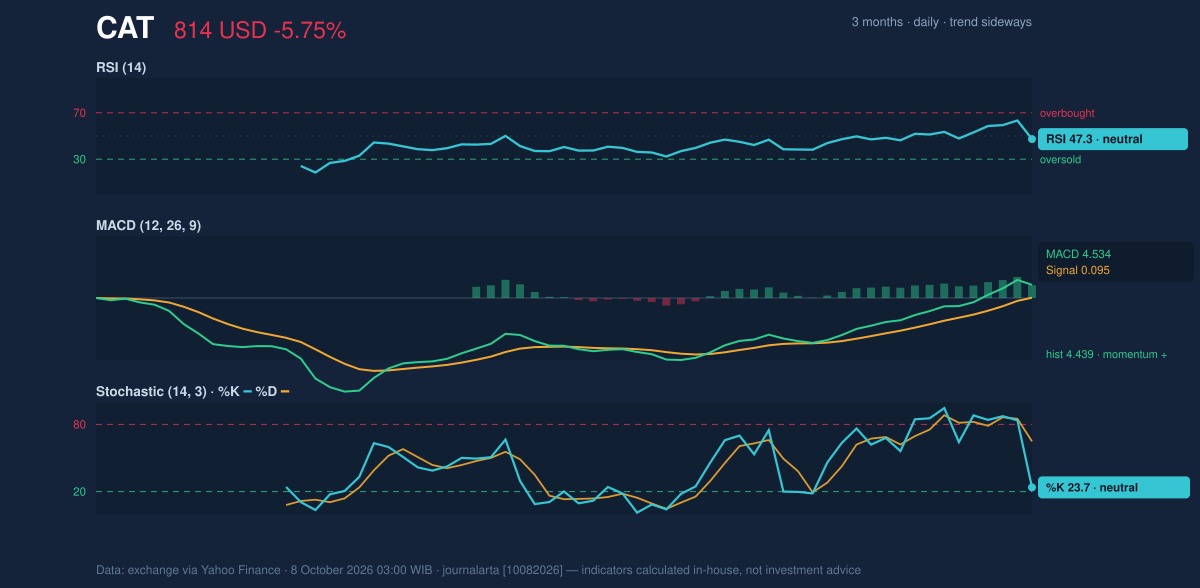
Volatility, Volume & Key Levels
Caterpillar’s Bollinger bands are at normal width, with the price near the centre line: the band midpoint is $814.97, the upper band $855.68 and the lower band $774.25. The %B reading of 49% places the shares around the middle of the band rather than at an extreme. That matters because the latest sell-off has not, on this measure, pushed CAT into an unusually stretched position. Average true range (ATR), a measure of typical price movement, is $24.46, or 3.0% of the share price—consistent with moderate volatility even as this session’s move was unusually large relative to that average. Volume reached 3,338,000 shares, against a 20-day average of 2,382,450, while on-balance volume (OBV), which tracks whether trading volume accompanies rising or falling prices, is increasing. Higher-than-usual volume lends weight to the decline, but rising OBV suggests participation has not turned uniformly negative. A hold above $782.72 support would keep the stock within its recent range; a break below it would weaken that structure, with the three-month low at $771.39 the next notable reference in the supplied data. A recovery above $821.90, the 50-day average, would improve the near-term picture, while $863.44 resistance remains the upper boundary of the 20-day range.Technical Verdict: HOLD (wait & see)
The indicators support a wait-and-see reading, not a clear directional signal: - Price is below both the 20-day and 50-day averages, but the 20-day average is rising and no new moving-average crossover has formed. - RSI and Stochastic are neutral, while MACD remains positive—conflicting momentum evidence. - The session’s elevated volume reinforces the sharp decline, but rising OBV and a normal-width Bollinger band argue against treating it as a confirmed breakdown. The verdict is invalidated if CAT falls below $782.72, the stated 20-day support. - Indicative entry range: $782.72–$814.97, spanning 20-day support to the 20-day average. - Indicative exit target: $863.44, the 20-day resistance. - Indicative stop-loss protection: below $782.72, aligned with the support break that would invalidate this assessment. For non-traders, the indicators are sending mixed messages, so the shares have not yet shown a clear technical direction.Summary Data CAT
| Last price | 813.83 USD |
| Change 1 day / 5 days / 1 month | -5.75% / 0.37% / -0.21% |
| Trend / MA-cross | sideways / none |
| SMA20 / SMA50 | 814.97 / 821.90 |
| RSI (14) / Stochastic %K | 47.3 / 23.7 |
| Bollinger %B / ATR | 49% / 24.46 |
| Support / Resistance 20 days | 782.72 / 863.44 |
| Data as of | 8 October 2026 03:00 WIB |
Disclaimer: This technical analysis is generated automatically from exchange data (via Yahoo Finance) and indicators calculated by JournalArta, for information and education only. The verdict and the entry, target and stop-loss levels are not investment advice or a solicitation to buy or sell any security. Investment decisions and their risks rest solely with the reader.
Track CAT stock price daily: live levels, support/resistance and our full CAT analysis history.