GOOGL Stock Analysis: Gains 1.22%, Momentum Weakens
On Agustus 24, 2026: price 344.82 USD, trend sideways, RSI 46.9, support 326.56, resistance 377.65. technical analysis of googl stock. GOOGL Stock Analysis —…
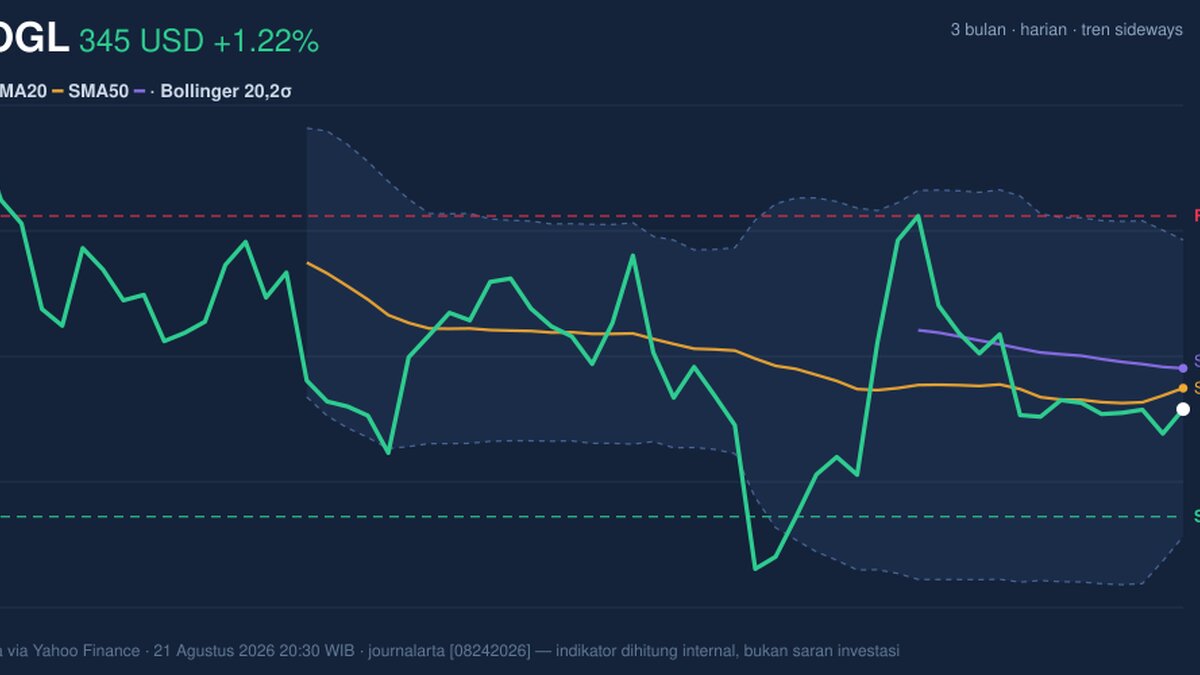
Alphabet’s latest tape shows a market trying to stabilise after a mild rebound, but still trading below key trend markers that often tell investors whether a move has real follow-through or just a temporary bounce. At 344.82 USD, GOOGL is up 1.22% on the day, yet remains below its short- and medium-term averages, a sign that the stock has not fully reclaimed control from sellers.
Alphabet Inc. (NASDAQ: GOOGL) closed at 344.82 USD, above the previous close of 340.67 USD, but the broader message from the chart is more cautious than the daily gain suggests. The stock is still trading below SMA20 at 348.40 and below SMA50 at 351.77, which matters because moving averages are a simple way of showing where recent buyers and sellers have been willing to transact. When price stays under both, it usually means the market has not yet confirmed a clean recovery trend. The absence of a fresh MA-cross reinforces that this is still a sideways phase rather than a decisive trend reversal. As shown in the chart, the stock is sitting in the lower half of its recent band, with room to move either way.
Trend & Price Action
The wider pattern is best described as sideways, with the SMA20 slope at 0.57% over 5 days suggesting mild stabilisation rather than strong acceleration. That is important: a positive slope tells traders the short-term average is rising, but the fact that price remains below it means the improvement has not yet been strong enough to pull the stock back above the line. In practical terms, Alphabet is trying to build a base, but the base is not yet confirmed.
The stock’s position within its recent range also adds context. With 20h support at 326.56 and 20h resistance at 377.65, GOOGL is currently around the 36% mark of that range, closer to support than resistance. That positioning suggests the market has not fully recovered the upper half of the trading band. The 3-month high of 393.88 and 3-month low of 314.90 frame the broader battle: price is well above the low, but still a meaningful distance from the high, which is why the current move looks more like consolidation than a breakout.
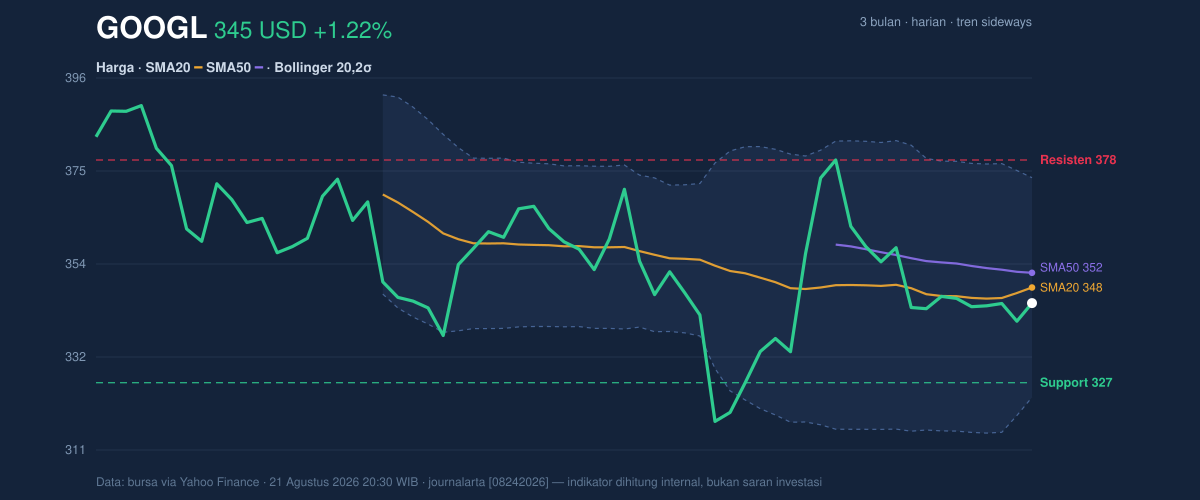
A short line says it plainly: the stock is improving, but it has not yet won back the trend.
Oscillators & Momentum
Momentum signals are mixed, and that mix is what makes the chart interesting. The RSI at 46.9 sits in neutral territory, which means the stock is neither stretched on the upside nor washed out on the downside. In plain language, RSI is saying the market is undecided. That matters because neutral RSI often appears when a stock is waiting for a fresh catalyst.
By contrast, the Stochastic %K at 13.6 and %D at 9.6 are in oversold territory, which usually indicates the recent sell-off has gone far enough to make the stock vulnerable to a bounce. But oversold does not automatically mean reversal; it only means downside momentum may be losing force. The MACD at -2.371, still below the signal line at -1.811, keeps the broader momentum tone negative. The histogram at -0.560 shows that bearish momentum is still present, even if it is not necessarily intensifying.
That combination — neutral RSI, oversold Stochastic, negative MACD — often points to a stock in transition rather than one already turning decisively. As shown in the chart, the momentum picture is leaning toward a possible rebound, but confirmation is missing.
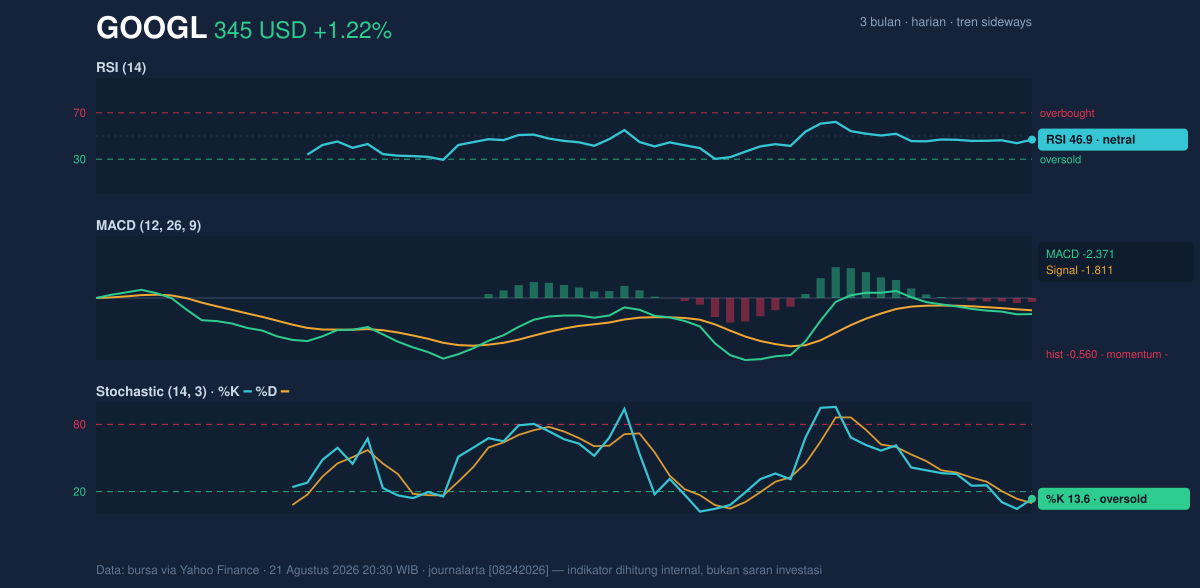
The key signal here is not that momentum is weak; it is that momentum is no longer one-directional.
Volatility & Volume
Volatility is present, but not extreme. The ATR(14) at 8.29, equal to 2.4% of price, suggests moderate daily movement. ATR measures the average size of recent price swings, so this reading implies Alphabet can still move meaningfully in either direction without being unusually turbulent. The Bollinger Bands help frame that risk: the upper band at 373.59, middle band at 348.40, and lower band at 323.21 show price trading below the centre line, while %B at 43% places the stock below mid-band but not near the lower edge. In simple terms, the stock is not under severe pressure, but it has not re-entered strength territory either. The 14.5% band width is normal, which means there is no squeeze suggesting an imminent explosive move.
Volume is not offering strong confirmation. The latest volume of 20,803,700 is only 0.8x the 20h average of 26,697,825, so the day’s rise came on lighter participation than usual. That weakens the quality of the rebound because stronger recoveries are usually accompanied by heavier trading. The falling OBV, or on-balance volume, adds another caution flag: it suggests that overall volume flow has been more consistent with distribution than accumulation.
In other words, price is bouncing, but the crowd is not yet fully backing it.
Key Levels & Scenarios
The chart’s most important level set is straightforward. Support at 326.56 is the first line that must hold if the current base is to remain intact. Below that, the lower Bollinger band at 323.21 becomes the next technical reference, and a move through that area would suggest the recent stabilisation has failed. On the upside, 348.40 — the SMA20 and Bollinger middle band — is the first reclaim point, followed by 351.77 at the SMA50. Above that, 377.65 resistance is the near-term ceiling that would need to be cleared to change the tone of the chart more decisively.
If price holds above 326.56 and starts closing back above 348.40, the setup improves because the stock would be moving back toward the centre of its range with momentum confirmation. If it fails to hold 326.56, the chart shifts back toward the lower band and the recent bounce would look fragile.
Technical Verdict: HOLD (wait & see)
HOLD (wait & see) fits the current setup because the stock is still below SMA20 at 348.40 and SMA50 at 351.77, while MACD remains negative; however, Stochastic is oversold, which leaves room for a rebound if buyers step in. The volume at 0.8x normal and falling OBV mean the latest lift is not yet strongly confirmed. This verdict is invalidated if price falls below 326.56, because that would weaken the current support structure and expose the lower band at 323.21.
- Ideal Entry Range: 326.56 to 348.40
- Exit Target: 351.77, then 377.65
- Stop Loss protection: below 323.21
For non-traders: Alphabet is trying to recover, but it has not yet proved that the rebound is strong enough to trust.
Summary Data GOOGL
| Last price | 344.82 USD |
| Change 1 day / 5 days / 1 month | 1.22% / -0.31% / 7.84% |
| Trend / MA-cross | sideways / none |
| SMA20 / SMA50 | 348.40 / 351.77 |
| RSI (14) / Stochastic %K | 46.9 / 13.6 |
| Bollinger %B / ATR | 43% / 8.29 |
| Support / Resistance 20 days | 326.56 / 377.65 |
| Data as of | 21 Agustus 2026 20:30 WIB |
Track GOOGL stock price daily: live levels, support/resistance and our full GOOGL analysis history.