DBS Stock Drops 0.37%, Momentum Weakens In Focus
On Agustus 25, 2026: price 75.56 SGD, trend uptrend, RSI 60.7, support 73.55, resistance 76.99. technical analysis of dbs stock. DBS Stock Drops — full details…
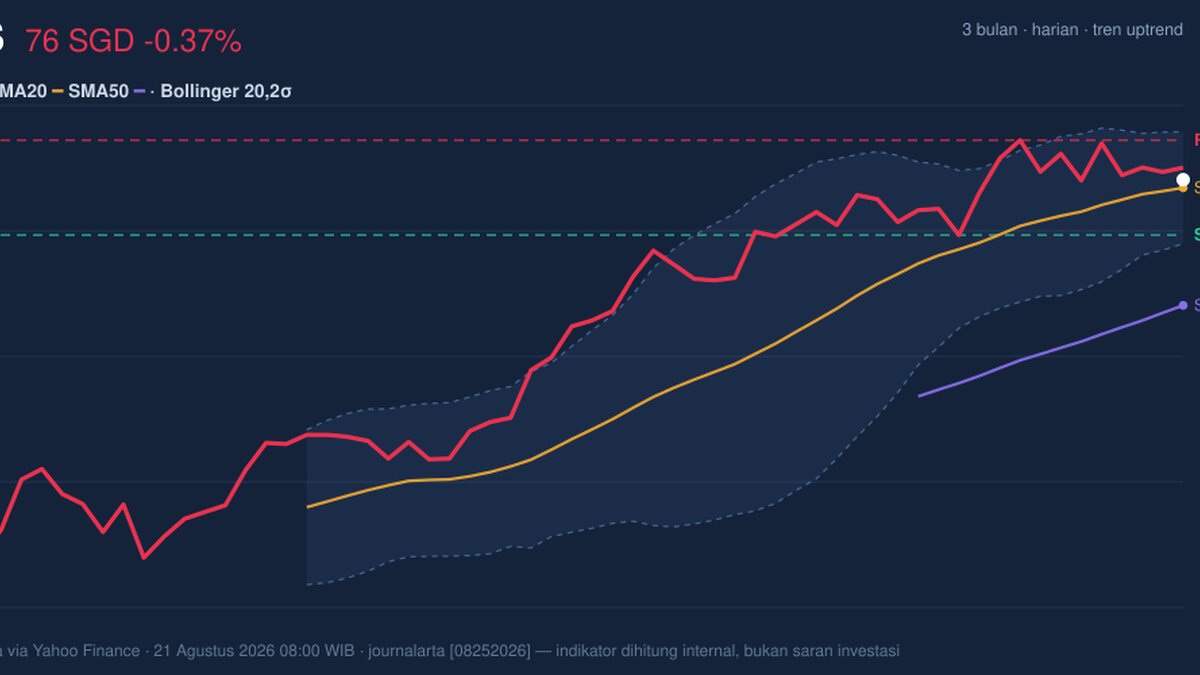
DBS Group’s shares were little changed at SGD 75.56 on SGX, easing 0.37% from the previous close even as the stock remained in a broader upward trend, according to data from Yahoo Finance as of 21 August 2026 08:00 WIB. The key message is not the small daily dip itself, but where the price sits: above its short- and medium-term trend lines, yet still below the recent ceiling that has capped the advance. That leaves DBS in a technically constructive position, but not one with clear momentum leadership.
Trend & Price Action
The chart shows DBS trading above its SMA20 at SGD 75.27 and well above its SMA50 at SGD 70.99, a pattern that usually signals the market is still willing to pay up for the stock on pullbacks. The SMA20 is rising at 1.17% over five days, which matters because a rising short-term average often acts like a moving floor: it tells you buyers have been stepping in soon after dips rather than waiting for deeper discounts. There is no fresh MA-cross, so the trend is not being reinforced by a new moving-average crossover, but the existing alignment remains supportive.
Price is also sitting in the upper half of its recent band, at 58% of the 20-hour range, between support at SGD 73.55 and resistance at SGD 76.99. That positioning suggests the stock is not stretched, but neither is it breaking out decisively. The 3-month range, from SGD 61.60 to SGD 77.97, shows DBS has already done most of the heavy lifting from the lows and is now testing the upper end of that broader corridor.
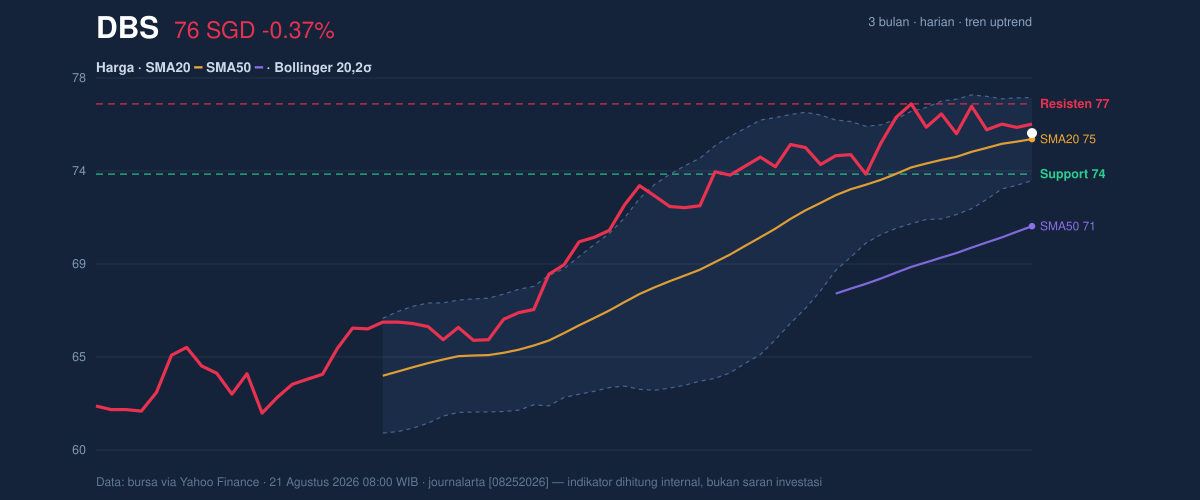
The immediate read is simple: the trend is intact, but the market is waiting for a cleaner push through resistance.
Oscillators & Momentum
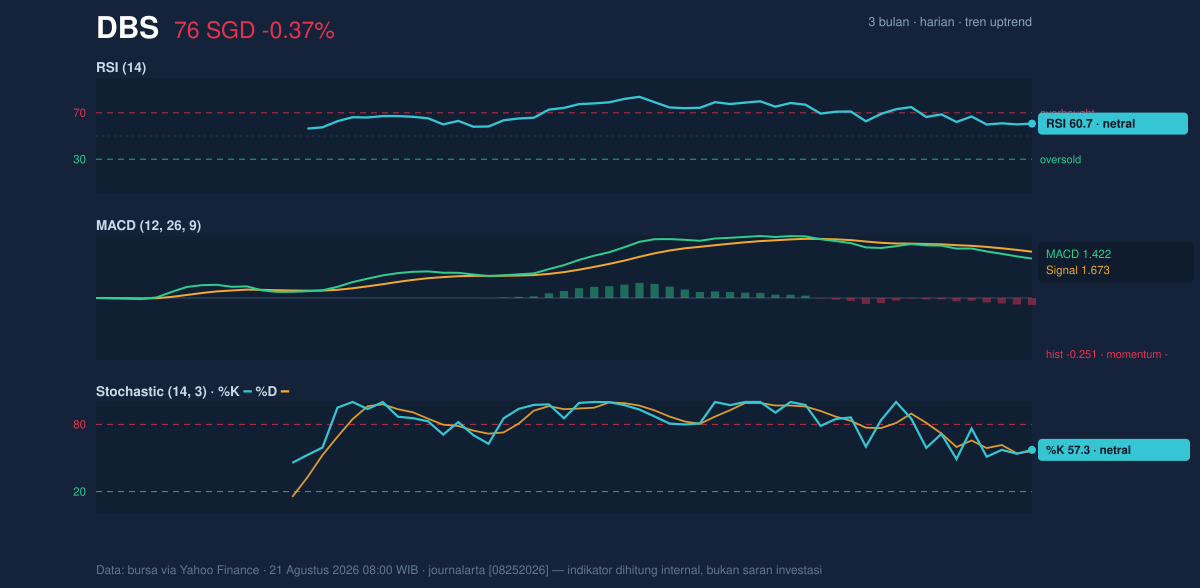
Momentum is more mixed than the trend. The RSI at 60.7 is neutral-to-firm rather than overheated, which means DBS has room to extend without immediately running into classic overbought conditions. The Stochastic %K at 57.3 and %D at 56.1 also sit in neutral territory, showing neither an exhausted rally nor a deeply oversold setup. In plain language, the stock is not flashing a reversal warning from the oscillators.
The caution comes from MACD. The MACD at 1.422 sits below its signal line at 1.673, with a histogram of -0.251. That negative histogram matters because it means short-term momentum has slipped under the smoother trend signal, even though the broader price structure still points up. This is often what a market looks like when it is pausing after a run: the trend is alive, but the pace has cooled.
So the signal is not bearish outright. It is a reminder that the stock needs fresh buying interest to move from “holding up well” to “driving higher.”
Volatility & Volume
Bollinger Bands reinforce that idea. DBS is trading around the middle of the band structure, with the middle band at SGD 75.27, the upper band at SGD 77.30 and the lower band at SGD 73.23. The %B reading of 57% shows price is slightly above the midpoint of the envelope, while the 5.4% band width indicates a squeeze. A squeeze usually means volatility has contracted and the market is coiling for a larger move; it does not say which direction, only that the next swing could be sharper than the recent day-to-day drift.
ATR adds another layer. At 1.31, or 1.7% of price, volatility is moderate rather than wild. That fits the picture of a stock that is stable enough to hold trend support, but still capable of a meaningful move if resistance gives way.
Volume is less convincing. The latest turnover of 3,367,900 is only 0.7 times the 20-session average of 4,649,504. That means the market is not yet showing strong participation behind the current price level. Yet the OBV is rising, which is important because on-balance volume tracks whether volume is, on net, flowing into the stock. Rising OBV while spot volume is subdued often suggests accumulation is happening quietly rather than in a headline-grabbing burst.
Key Levels & Scenarios
The nearest technical battleground is clear: support at SGD 73.55 and resistance at SGD 76.99. Above that, the Bollinger upper band at SGD 77.30 and the 3-month high at SGD 77.97 form the next overhead markers. Below, the Bollinger lower band at SGD 73.23 and the broader trend cushion near the SMA20 at SGD 75.27 define where buyers have recently been defending.
If DBS can clear SGD 76.99 with improving volume, the squeeze in Bollinger Bands suggests the stock could attempt a more decisive expansion toward the upper band and beyond. If it slips back through SGD 75.27 and then fails to hold SGD 73.55, the current uptrend would start looking more fragile, especially with MACD already negative on the histogram. The technical picture is therefore one of compression: trend support underneath, but a ceiling still in place.
Technical Verdict: HOLD (wait & see)
HOLD (wait & see)
- Reason 1: Trend remains constructive — price is above the SMA20 and SMA50, with the SMA20 slope rising.
- Reason 2: Momentum is not confirming a breakout — MACD is below signal and the histogram is negative, even though RSI and Stochastic are neutral.
- Reason 3: Bollinger Bands are squeezing — that points to a possible move, but not yet a confirmed direction, while volume remains below average.
- Verdict invalidated if price falls below SGD 73.55, which would weaken the near-term support structure and challenge the current trend setup.
- Ideal Entry Range: SGD 73.55 to SGD 75.27
- Exit Target: SGD 76.99 to SGD 77.30
- Stop Loss protection: below SGD 73.23
For non-traders, this means DBS still looks technically healthy, but the chart is waiting for proof that buyers can push it through the current ceiling.
“The stock is coiled, but it still needs a catalyst to prove the next move.”
Summary Data DBS
| Last price | 75.56 SGD |
| Change 1 day / 5 days / 1 month | -0.37% / 0.04% / 2.80% |
| Trend / MA-cross | uptrend / none |
| SMA20 / SMA50 | 75.27 / 70.99 |
| RSI (14) / Stochastic %K | 60.7 / 57.3 |
| Bollinger %B / ATR | 57% / 1.31 |
| Support / Resistance 20 days | 73.55 / 76.99 |
| Data as of | 21 Agustus 2026 08:00 WIB |
Track DBS share price daily: live levels, support/resistance and our full DBS analysis history.