MA Stock Technicals Today: Gains 3.31%, RSI Overbought
On Agustus 25, 2026: price 599.86 USD, trend uptrend, RSI 73.3, support 559.73, resistance 599.86. technical analysis of ma stock. MA Stock Technicals — full…
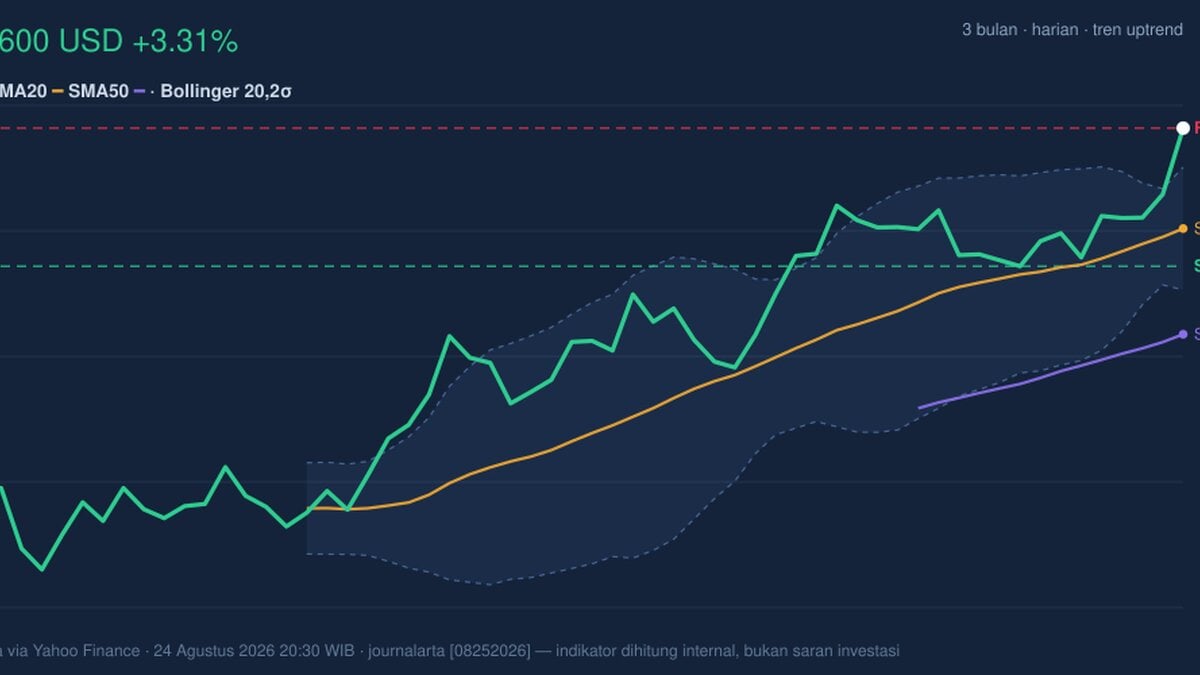
Mastercard (MA) closed at 599.86 USD on the NYSE, up 3.31% in the latest session and extending its 1-month gain of 8.73%, according to Yahoo Finance data cited on 24 August 2026 at 20:30 WIB. The move leaves the card network at the top of its 3-month range, just shy of the 599.99 high, and it does so with a chart that still points upward — but with momentum now hot enough to demand caution. The key question is no longer whether the trend is intact; it is whether the stock can keep climbing without first pausing to cool off.
Trend & Price Action
As shown in the chart, Mastercard remains in a clear uptrend, with the SMA20 at 570.66 sitting above the SMA50 at 539.95. That alignment matters because it shows the shorter-term average is still leading the longer one, a classic sign that buyers have controlled the tape for several weeks. The stock is also trading above the SMA20, and the SMA20 slope of 1.88% over 5 days suggests the trend is not merely intact but still leaning higher. With price sitting at 100% of its 20-hour range and pressing the top of the 3-month band, the chart is extended rather than cheap.
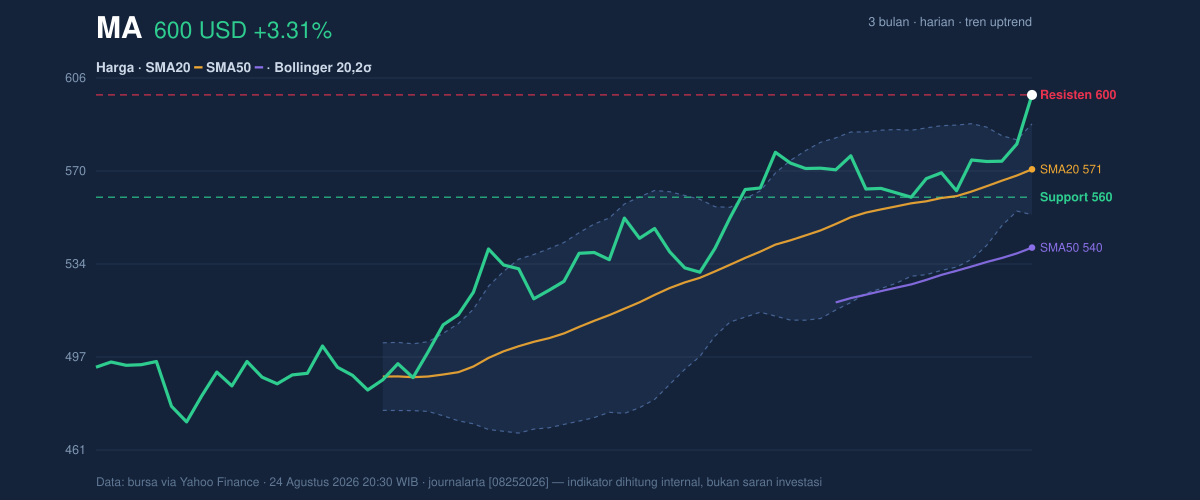
The important signal here is not just that price is high; it is that it is high while the moving averages are still rising. That combination usually reflects persistent demand, but it also means fresh upside now has less room before the stock meets overhead pressure at the recent peak.
Oscillators & Momentum
Momentum is strong, but it is also stretched. The RSI at 73.3 and Stochastic %K at 99.7 / %D at 85.2 both sit in overbought territory, which usually means buyers have been aggressive enough that the stock may need consolidation before another leg higher. Overbought does not automatically mean reversal; in a strong trend, it often means the stock is powerful enough to stay elevated for longer than expected. Still, it does warn that the next move may be more uneven than the last one.
MACD at 11.511, above its signal line at 10.709, with a 0.801 histogram, shows that upward momentum is still confirmed. In plain language, the trend engine is still running, even if the fuel gauge is getting hot. The chart suggests strength is present, but not fresh. That difference matters.
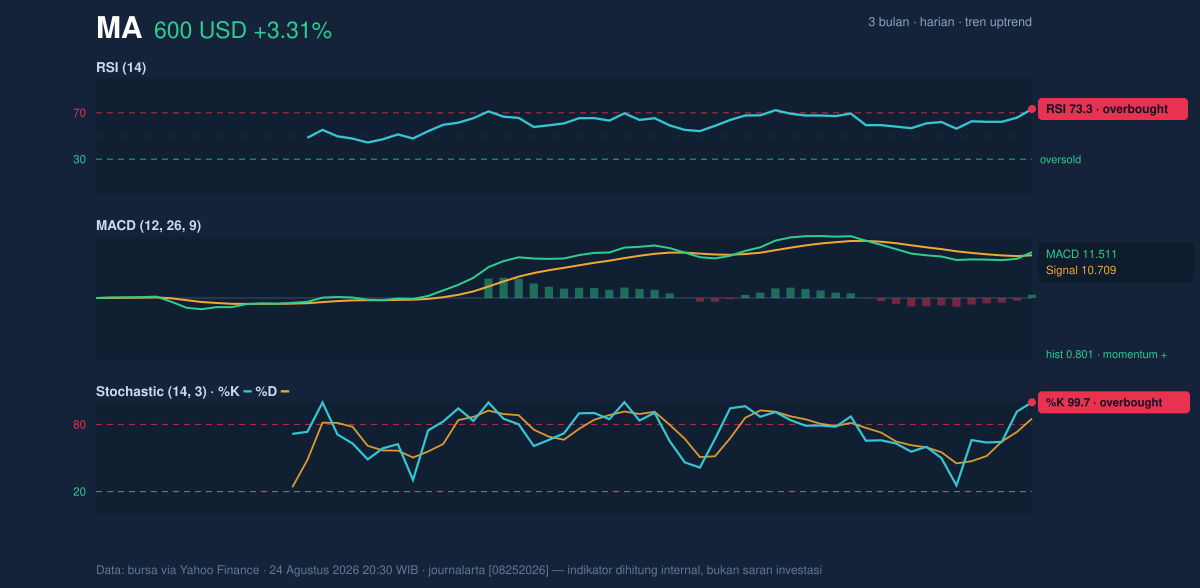
The signal mix is therefore mixed in a specific way: trend and MACD are supportive, while RSI and Stochastic are warning that the stock may be overextended in the short term.
Volatility & Volume
Bollinger Bands add another layer to that reading. Mastercard is trading above the upper Bollinger band at 588.47, with %B at 132%, which means price is not just near the upper edge of its recent volatility envelope — it is beyond it. That often happens during breakout behavior, but it also raises the odds of mean reversion, especially when the Bollinger width is only 6.2% and described as a squeeze. A squeeze means volatility has been compressed; when price breaks out of a squeeze, moves can be sharp. The challenge is that those moves can cut both ways if the breakout loses conviction.
Volume is helping, but only modestly. Last volume of 3,122,300 was essentially in line with the 20-day average of 3,114,420, or 1.0× normal. That tells us the latest push higher was not accompanied by a major burst of participation. On the positive side, OBV is rising, which means volume flow has generally been supportive of the advance. On the cautionary side, the absence of a big volume surge suggests the breakout is being driven more by steady accumulation than by a decisive rush of new money.
Strong, but not explosive.
Key Levels & Scenarios
The most immediate reference point is the 20-hour support at 559.73. That level matters because it sits below the SMA20 at 570.66 and near the center of the recent structure; if price slips back through it, the market would be signaling that the latest extension has lost traction. On the upside, the nearest resistance is effectively the current high area at 599.86, with the 3-month high at 599.99 acting as the next obvious test. Since price is already pressing that ceiling, any clean move through it would likely confirm that the squeeze has resolved to the upside.
In scenario terms, if Mastercard holds above the 588.47 upper Bollinger band and continues to respect the rising SMA20, the chart remains constructive. If it fails to stay above the 559.73 support, the message changes quickly: the move would start looking like a failed breakout rather than a trend continuation. The presence of a squeeze makes that distinction especially important, because compressed volatility can produce fast follow-through — or fast reversals.
Technical Verdict: HOLD (wait & see)
HOLD (wait & see) is the cleanest technical reading here because the trend is bullish, but the stock is also stretched at a critical ceiling.
- MACD remains positive, confirming the uptrend is still active.
- RSI 73.3 and Stochastic 99.7 / 85.2 are overbought, signaling short-term exhaustion risk.
- Price above the upper Bollinger band at 588.47 with a 6.2% squeeze suggests breakout potential, but also a higher chance of whipsaw.
Verdict invalidated if price falls below 559.73, which would weaken the current structure and undermine the breakout setup.
- Ideal Entry Range: 559.73 to 570.66
- Exit Target: 599.99
- Stop Loss protection: below 559.73
For non-traders, this means Mastercard still looks strong, but the chart is hot enough that patience matters more than chasing the latest move.
“The market is still bidding the stock up, but it is doing so right at the edge of its recent ceiling.”
Summary Data MA
| Last price | 599.86 USD |
| Change 1 day / 5 days / 1 month | 3.31% / 6.69% / 8.73% |
| Trend / MA-cross | uptrend / none |
| SMA20 / SMA50 | 570.66 / 539.95 |
| RSI (14) / Stochastic %K | 73.3 / 99.7 |
| Bollinger %B / ATR | 132% / 10.47 |
| Support / Resistance 20 days | 559.73 / 599.86 |
| Data as of | 24 Agustus 2026 20:30 WIB |
Track MA stock price daily: live levels, support/resistance and our full MA analysis history.