META Stock Gains 1.66%, Momentum Weakens In Focus
On Agustus 25, 2026: price 559.02 USD, trend downtrend, RSI 42.3, support 539.03, resistance 599.12. technical analysis of meta stock. META Stock Gains — full…
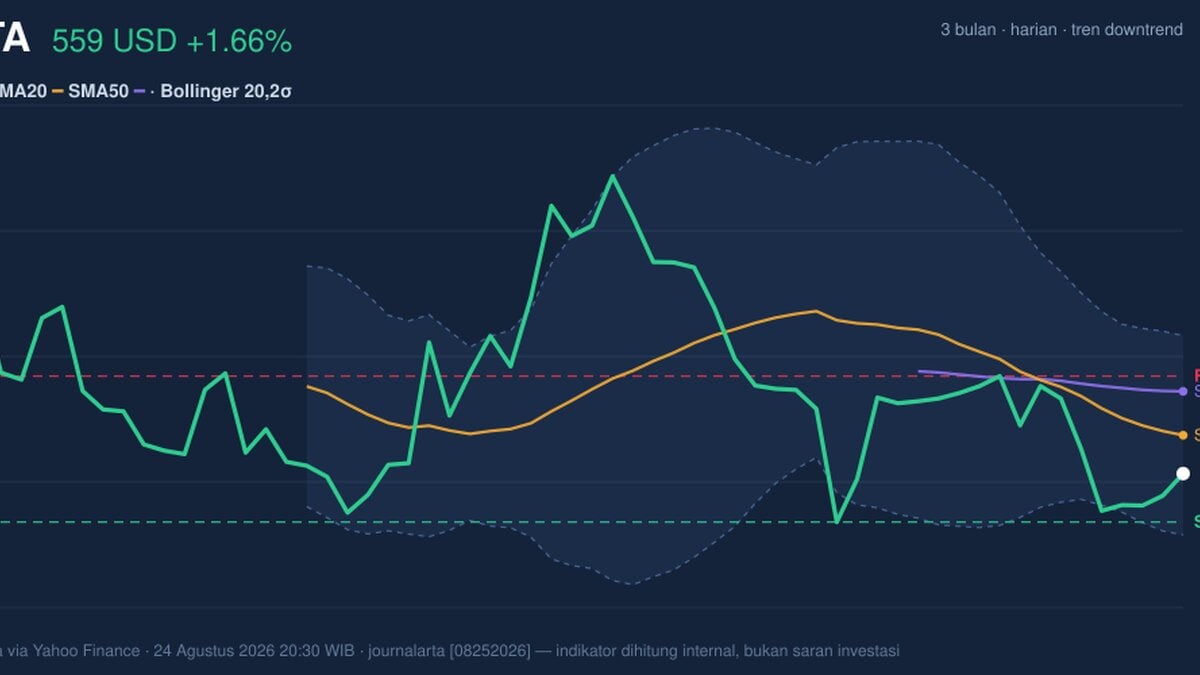
Meta Platforms fell to 559.02 USD on Nasdaq, up 1.66% on the day but still below its short- and medium-term trend markers, a combination that says more about a rebound inside a weak structure than a clean recovery. The stock is trading under both the SMA20 at 574.74 and the SMA50 at 592.80, while the broader pattern remains a downtrend. That matters because price sitting below both moving averages usually signals that sellers still control the intermediate trend, even if buyers can still force brief rallies.
Trend & Price Action
The key message in the chart is that Meta is trying to bounce, but it has not yet repaired the damage done over the past month. The stock is down 5.87% over one month and 1.75% over five days, which tells readers the latest gain has not reversed the larger slide. More importantly, the SMA20 is falling at -2.72% over five days, a slope that shows the near-term average is still rolling lower rather than flattening out. That is usually the signature of a market that is still searching for a floor.
As shown in the chart, the price is positioned in the lower third of its recent range, at about 33% of the 20-hour range between 539.03 support and 599.12 resistance. That location is important: it means the bounce has not yet reached the area where sellers previously showed up, but neither has it broken the lower boundary that would signal a deeper unwind. The stock also sits well below its 3-month high of 686.08 and above its 3-month low of 524.49, leaving it in a middle zone where direction is still being decided.
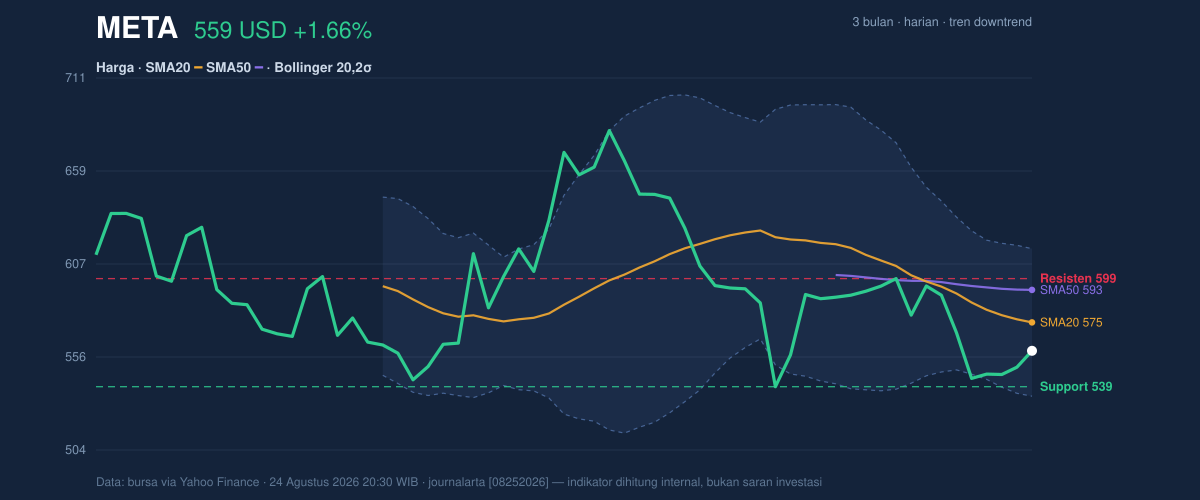
The Bollinger Bands help explain that indecision. Meta is trading below the middle band at 574.74, with %B at 31%, which means price is closer to the lower band than the upper one but not yet pressed into an extreme oversold zone. The lower band at 533.78 is the first technical cushion below current levels. Because the band width is 14.3% and described as normal, the market is not in a volatility squeeze that would usually precede a sharp breakout. In plain language, the stock has room to move, but the chart does not yet show the kind of compressed setup that often leads to an immediate explosive move.
Oscillators & Momentum
Momentum is mixed, and that is the central tension in the name right now. The RSI at 42.3 is neutral but leaning weak, which means the stock is not oversold enough to imply a strong contrarian bounce, yet not strong enough to suggest buyers have regained control. The Stochastic %K at 28.9 and %D at 19.0 sit near the lower end of the range, which can indicate an attempted turn, but only if price starts to confirm it. Without that confirmation, the oscillator is simply saying the stock is near the weaker side of its recent trading band.
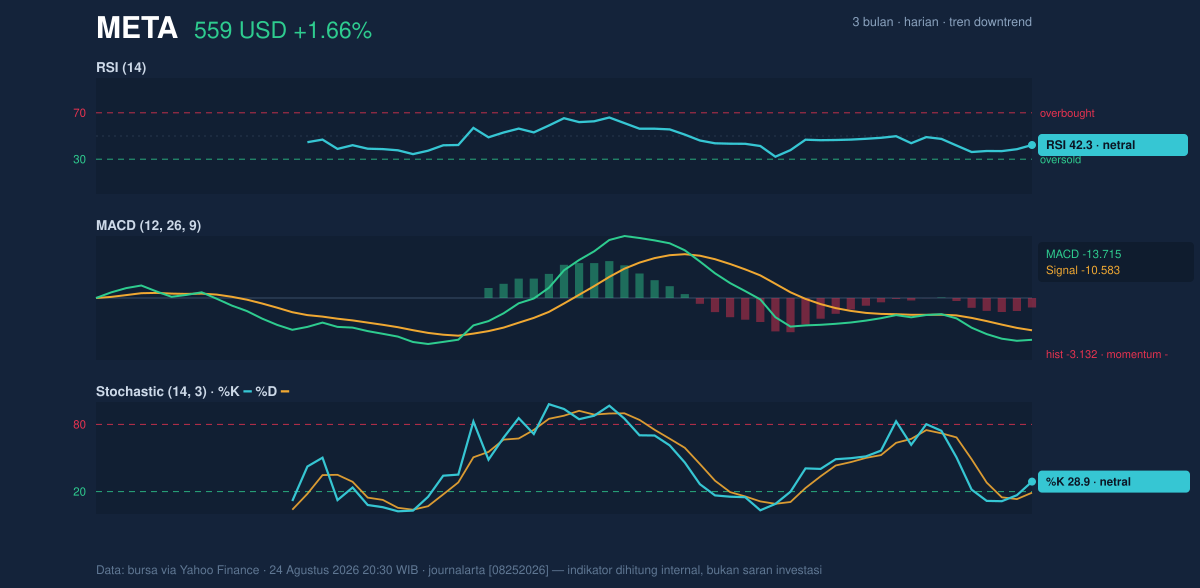
The cleaner warning comes from MACD. With MACD at -13.715, the signal line at -10.583, and a histogram of -3.132, momentum remains negative. For general readers, MACD compares faster and slower trend measures; when the faster line stays below the signal line and the histogram is negative, it usually means downside pressure is still outweighing upside follow-through. So even though the daily price change is positive, the momentum picture says the bounce has not yet become a trend reversal.
Volatility & Volume
Volatility is present, but not extreme. The ATR(14) of 17.06, equal to 3.1% of price, suggests a normal daily swing environment rather than a shock regime. That gives the stock enough movement for a test of nearby levels, but not enough to imply a disorderly break on its own. The more telling signal is participation: volume was 12,936,400 versus a 20-day average of 17,447,090, or 0.7x normal. In market terms, that means the latest move happened on lighter-than-usual trading, which weakens the case that the rebound was broadly endorsed.
The OBV is falling, and that matters because on-balance volume tracks whether money flow is supporting the price. When price tries to stabilize but OBV keeps slipping, it often signals that rallies are being met by distribution rather than accumulation. That is not a guarantee of more downside, but it does tell readers the burden of proof remains on buyers.
Key Levels & Scenarios
The first level to watch is 539.03 support. If Meta can hold above that area and start reclaiming the 574.74 mid-band and SMA20, the chart would begin to look less fragile. A move through 599.12 resistance would be more meaningful still, because it would place price back above a recent ceiling and closer to the SMA50 at 592.80, reducing the gap between price and trend.
If 539.03 fails, the next reference point is the 533.78 lower Bollinger Band, and beneath that the 3-month low of 524.49. That sequence matters because each lower level would show that the market is no longer just correcting within a range but pushing toward a fresh leg lower. The fact that current price is still above the 3-month low gives the chart some breathing room, but not much.
Technical Verdict: HOLD (wait & see)
The setup is neither strong enough for a trend reversal nor weak enough to confirm a fresh breakdown. Price remains below the SMA20 and SMA50, MACD is still negative, and OBV is falling, all of which argue that the broader pressure is still downward. At the same time, RSI is neutral and the stock is not stretched into a deep oversold reading, so the chart is not showing a clear capitulation signal either.
- Entry Range: 539.03–574.74, where support and the Bollinger middle band may define whether the rebound has traction.
- Exit Target: 599.12, with the higher reference area around the SMA50 at 592.80 acting as an intermediate test.
- Stop Loss protection: 533.78, with deeper risk visible if price loses the 3-month low of 524.49.
- Verdict invalidated if price breaks below 539.03, because that would weaken the current floor and open the door to a lower range.
In plain English: Meta is trying to steady itself, but the chart still needs proof that the bounce is real. “Until price can reclaim the middle of the range, this is still a market that has to prove it deserves trust.”
Summary Data META
| Last price | 559.02 USD |
| Change 1 day / 5 days / 1 month | 1.66% / -1.75% / -5.87% |
| Trend / MA-cross | downtrend / none |
| SMA20 / SMA50 | 574.74 / 592.80 |
| RSI (14) / Stochastic %K | 42.3 / 28.9 |
| Bollinger %B / ATR | 31% / 17.06 |
| Support / Resistance 20 days | 539.03 / 599.12 |
| Data as of | 24 Agustus 2026 20:30 WIB |
Track META stock price daily: live levels, support/resistance and our full META analysis history.