Momentum Weakens, HSBC Stock Gains 1.76% Today
On Agustus 25, 2026: price 1,529.00 GBp, trend sideways, RSI 50.5, support 1,497.20, resistance 1,597.40. technical analysis of hsbc stock.
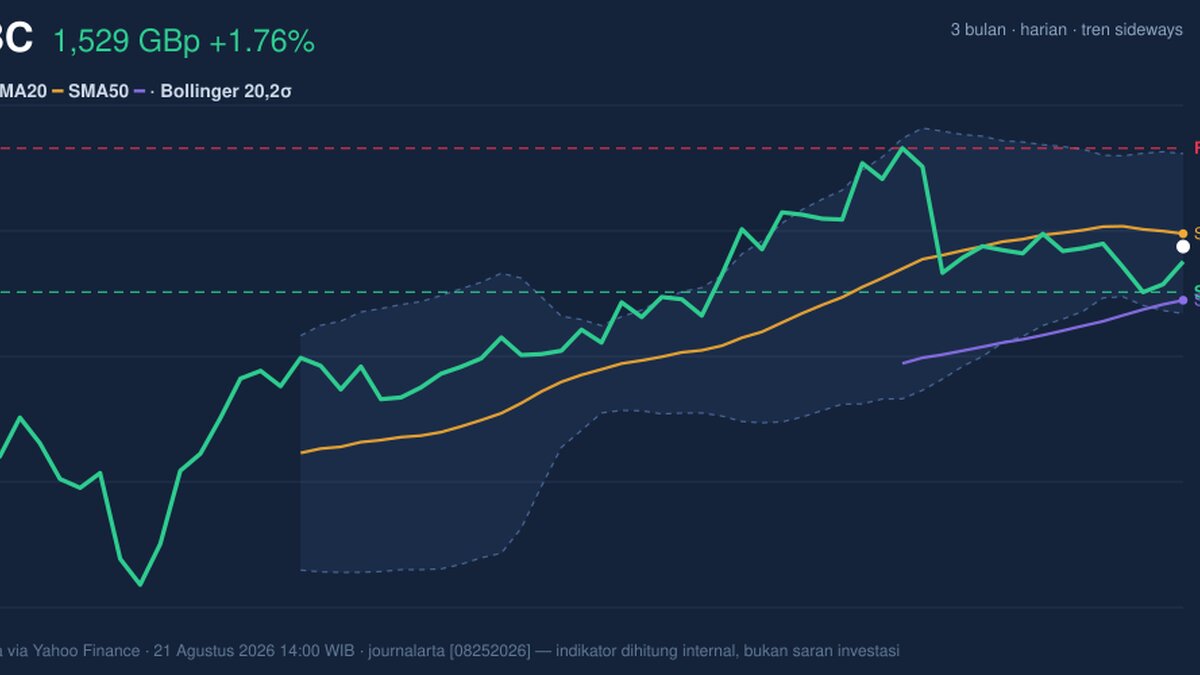
HSBC Holdings rose to 1,529.00 GBp on the London market by 21 August 2026 at 14:00 WIB, up 1.76% from the previous close of 1,502.60 GBp. The move matters less as a breakout than as a test of whether buyers can keep price above the lower half of the recent range: the shares are still below the 20-day average at 1,537.96, even as they remain comfortably above the 50-day average at 1,491.59. That leaves HSBC in a familiar middle ground — neither in clear downtrend nor in decisive recovery — with the chart showing a market that is waiting for confirmation rather than conviction.
Trend & Price Action
The broader structure is sideways, and the slope of the 20-day average is slightly negative at -0.15% over 5 days, which signals that short-term momentum has not yet turned decisively higher. Price sitting below SMA20 but above SMA50 is usually a sign of consolidation: the stock has not lost its medium-term floor, but it has also not reclaimed enough short-term strength to suggest a clean upward trend. The absence of a fresh moving-average cross adds to that neutral read. As shown in the chart, HSBC is trading at 32% of its 20-hour range, closer to support than resistance, with 1,497.20 acting as the nearest floor and 1,597.40 as the ceiling.
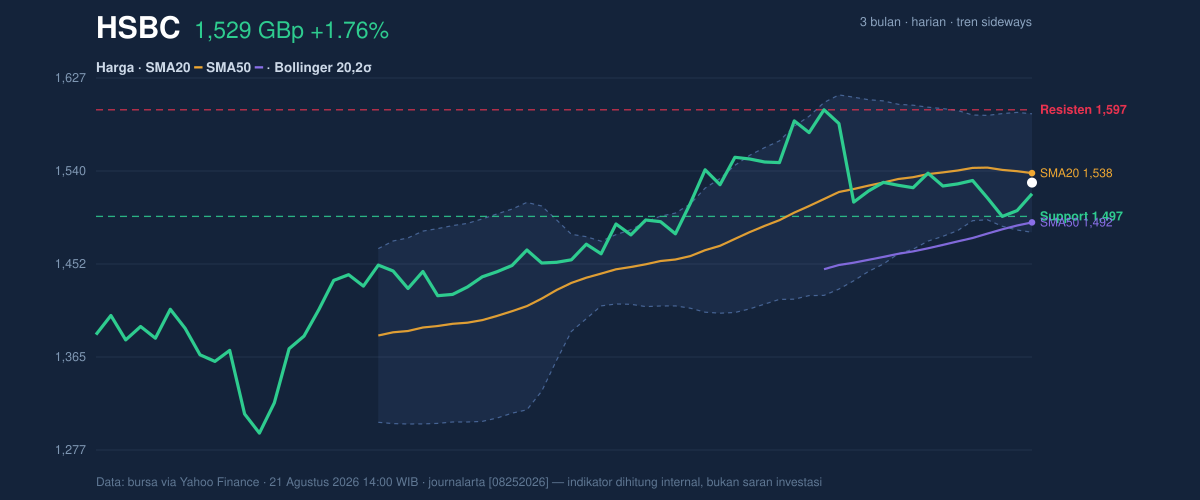
That positioning is important. When a stock trades in the lower third of its recent band while still above the longer average, it often means the market is not panicking — but it is not yet willing to pay up. The 3-month range underscores that tension: 1,610.00 is the recent high, while 1,267.20 marks the low. HSBC is far from the bottom, but it has not yet challenged the top in a convincing way.
Oscillators & Momentum
Momentum indicators are mixed, and that is the key message from the oscillators. RSI at 50.5 is essentially neutral, meaning the shares are neither overbought nor oversold. Stochastic %K at 32.2 and %D at 23.1 also sit in neutral territory, but with %K above %D, there is a mild short-term recovery signal. The problem is that the broader momentum gauge does not fully agree: MACD at 4.105 remains below its signal line at 11.727, leaving a -7.622 histogram. In plain language, that means the underlying trend impulse is still lagging even after the day’s gain.
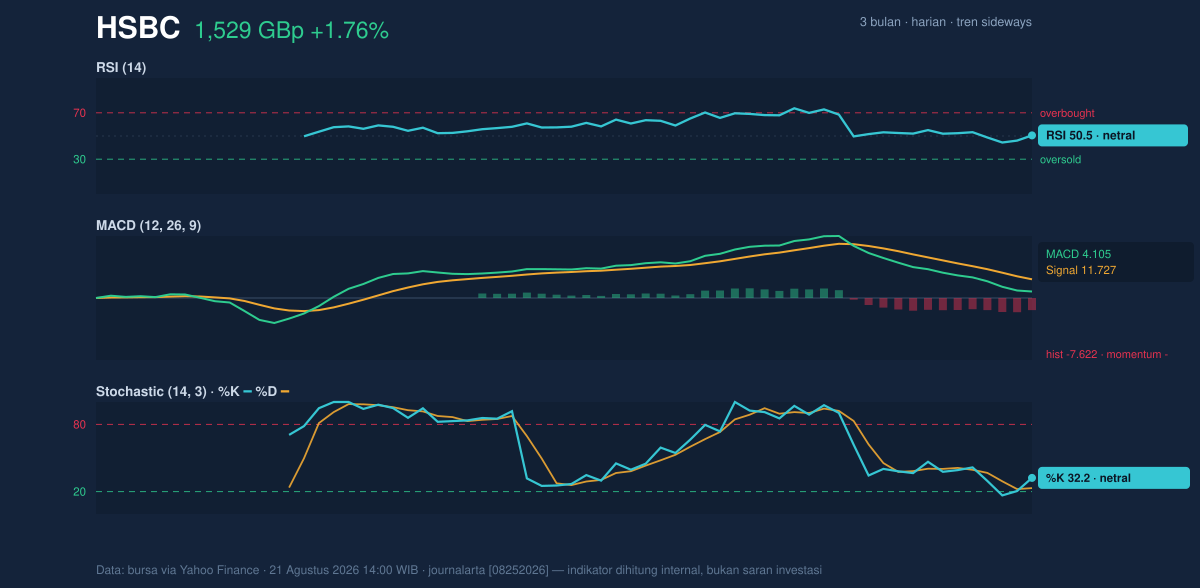
That combination usually points to a market that is stabilising, not accelerating. A neutral RSI can be constructive when price is near support, but a negative MACD histogram warns that rallies may still need more participation before they become durable. In other words, the stock has stopped looking weak enough to sell off aggressively, but it has not yet shown enough momentum to suggest a clean trend reversal.
Volatility & Volume
Volatility is not elevated, but it is not dead either. ATR(14) at 30.39, or 2.0% of price, indicates moderate daily movement potential. More interesting is the Bollinger setup: the band width is 7.2% and is narrowing, a classic squeeze condition that often precedes a larger move. Price is sitting at %B 42%, below the middle band at 1,537.96, which shows the shares are still trading in the lower half of the volatility envelope. A squeeze does not predict direction, but it does say the current calm may not last long.
Volume adds a cautionary note. The latest turnover of 18,769,794 shares was only 0.7× normal versus the 20-session average of 28,399,892. That means the day’s rise was not driven by especially heavy participation. Still, OBV is rising, which suggests that on balance, trading flow has been accumulating even if the latest session was not a volume surge. The signal is subtle: buyers are present, but not yet forceful.
Key Levels & Scenarios
The chart’s nearest decision points are clear. 1,497.20 is the first support to watch; it sits close to the 50-day average at 1,491.59, creating a cluster that could matter if the shares weaken again. Above, 1,537.96 is the immediate pivot, because it is both the 20-day average and the Bollinger middle band. A sustained move through that area would signal that the short-term drift is improving. Beyond that, 1,597.40 is the next resistance, and a push toward that level would bring the stock back toward the recent 1,610.00 high.
For now, the signal is conditional rather than decisive. If HSBC holds above 1,497.20 and reclaims 1,537.96, the chart would begin to look more constructive because price would be moving back toward the center of the band after a period of compression. If it fails to hold 1,497.20, the market would be telling us the recent bounce was only a pause inside a broader range.
Technical Verdict: HOLD (wait & see)
- Reason 1: Price is below SMA20 at 1,537.96 but above SMA50 at 1,491.59, which points to consolidation rather than a confirmed trend.
- Reason 2: RSI 50.5 and Stochastic 32.2 / 23.1 are neutral, while MACD 4.105 is below signal 11.727, so momentum is not fully aligned.
- Reason 3: The 7.2% Bollinger squeeze suggests a coming move, but volume at 0.7× normal means the latest rise lacks strong confirmation.
- Invalidation: this verdict is invalidated if price falls below 1,497.20.
- Ideal Entry Range: 1,497.20 to 1,537.96
- Exit Target: 1,597.40
- Stop Loss protection: below 1,491.59
For non-traders, this means HSBC is not showing enough evidence yet to call the next move with confidence.
Volume last session: 18,769,794 shares versus a 20-session average of 28,399,892.
Summary Data HSBC
| Last price | 1,529.00 GBp |
| Change 1 day / 5 days / 1 month | 1.76% / 0.08% / -1.53% |
| Trend / MA-cross | sideways / none |
| SMA20 / SMA50 | 1,537.96 / 1,491.59 |
| RSI (14) / Stochastic %K | 50.5 / 32.2 |
| Bollinger %B / ATR | 42% / 30.39 |
| Support / Resistance 20 days | 1,497.20 / 1,597.40 |
| Data as of | 21 Agustus 2026 14:00 WIB |
Track HSBC share price daily: live levels, support/resistance and our full HSBC analysis history.