Singtel Stock Technicals Today: Drops 0.67%, Momentum Gains
On Agustus 25, 2026: price 4.42 SGD, trend sideways, RSI 49.0, support 4.25, resistance 4.61. technical analysis of singtel stock. Singtel Stock Technicals —…
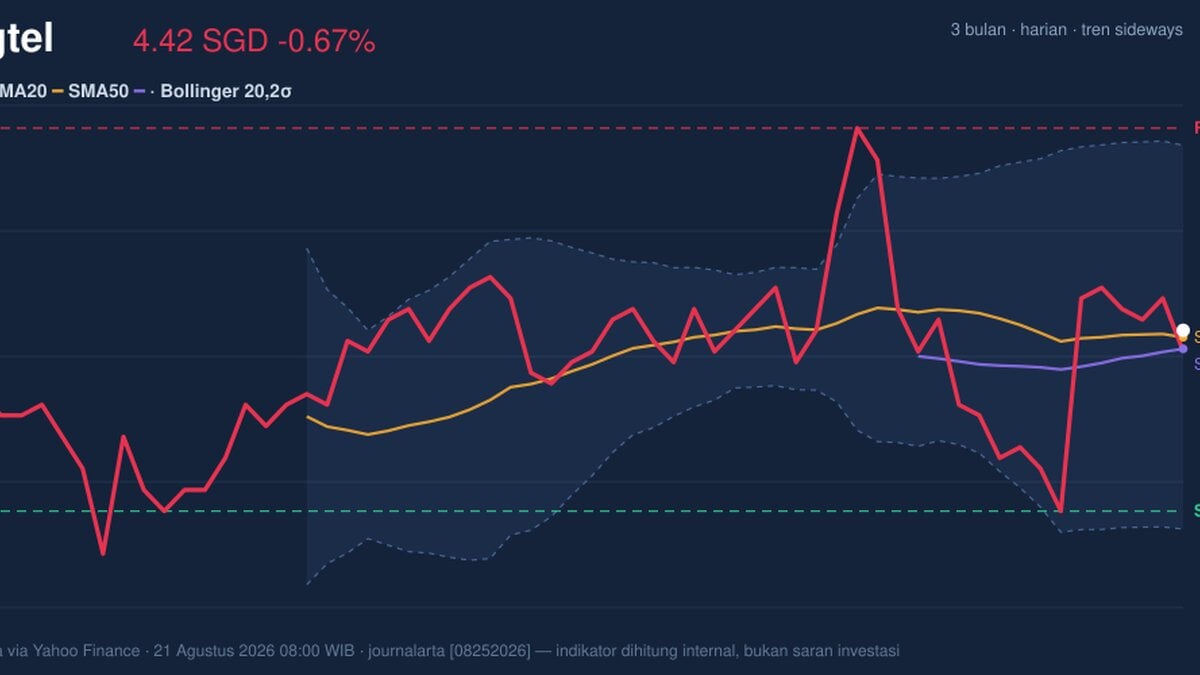
Singapore Telecom (Singtel) on SGX slipped to 4.42 SGD in the latest session, down from 4.45 the day before, as the stock continued to trade in a narrow, directionless band. The move leaves the share price just above its short-term averages, but the message from the tape is less about a decisive trend and more about a market waiting for a stronger catalyst.
Trend & Price Action
The chart shows a stock that is still boxed in rather than breaking out. Price is above SMA20 at 4.41 and SMA50 at 4.40, which is a mild sign of underlying stability, but the absence of a fresh MA-cross means there is no new trend signal to lean on. In plain terms, the short-term average has not pulled meaningfully away from the medium-term average, so the market has not yet committed to a stronger upward or downward phase.
That matters because the broader trend is still sideways, and the SMA20 slope of 0.02% over 5 days is almost flat. A flat slope usually signals balance between buyers and sellers, not conviction from either side. The share is also sitting at roughly 47% of the 20-hour range, which places it near the middle rather than near a breakout point. The 3-month range reinforces that picture: 4.70 is the recent high, while 4.15 marks the low, so the stock is trading in the middle of a wider corridor rather than near an extreme.
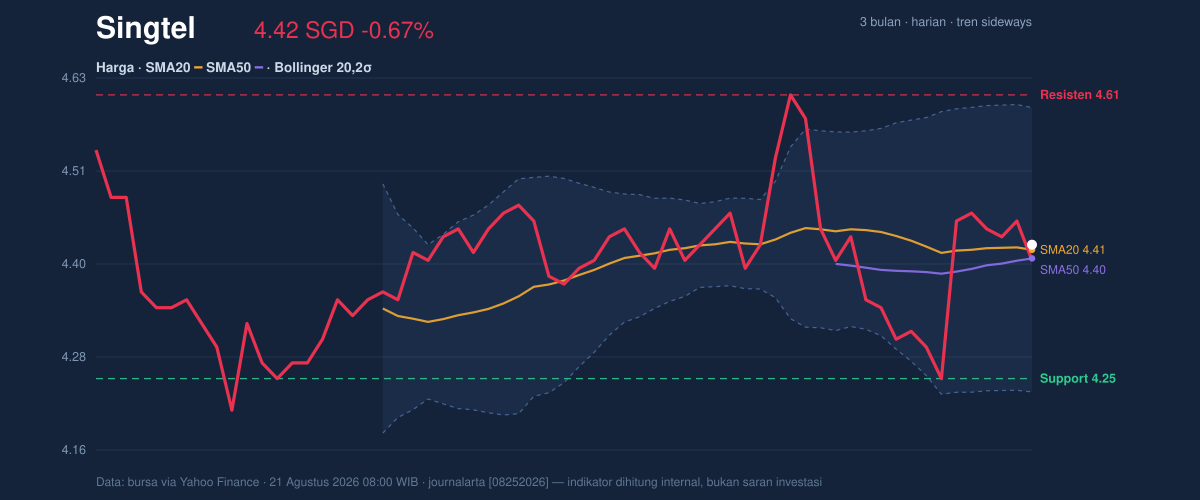
The Bollinger Bands add a useful nuance. With the middle band at 4.41, the stock is effectively hugging its short-term mean, while the upper band at 4.59 and lower band at 4.23 frame the current trading envelope. Since the band width is 8.2% and described as normal, this is not a compression setup that often precedes a sharp move. Instead, it suggests ordinary two-way trading. The fact that price is only slightly above the mid-band means the market is neither stretched nor deeply discounted.
Oscillators & Momentum
Momentum is mixed, but not broken. RSI at 49.0 is neutral, which tells readers the stock is neither overbought nor oversold and therefore has room to move in either direction. That neutral reading fits the sideways trend: momentum is not strong enough to force an escape from the range.
The stochastic oscillator is a touch firmer, with %K at 72.4 and %D at 69.7. That sits near the upper end of neutral territory and hints that short-term buying interest has improved. But because the reading is not paired with a clear trend breakout, it is better read as early strength than as confirmation of a sustained rally. In other words, the stock is leaning up, but only slightly.
The MACD is the most constructive of the momentum tools. MACD at -0.001 remains just below zero, yet the histogram at 0.006 is positive and the signal line at -0.007 sits below the MACD line. That combination usually means downside momentum is fading and the shorter-term trend is improving from a weak base. It is not a full bullish reversal signal, but it does show that momentum is recovering before price has fully responded.
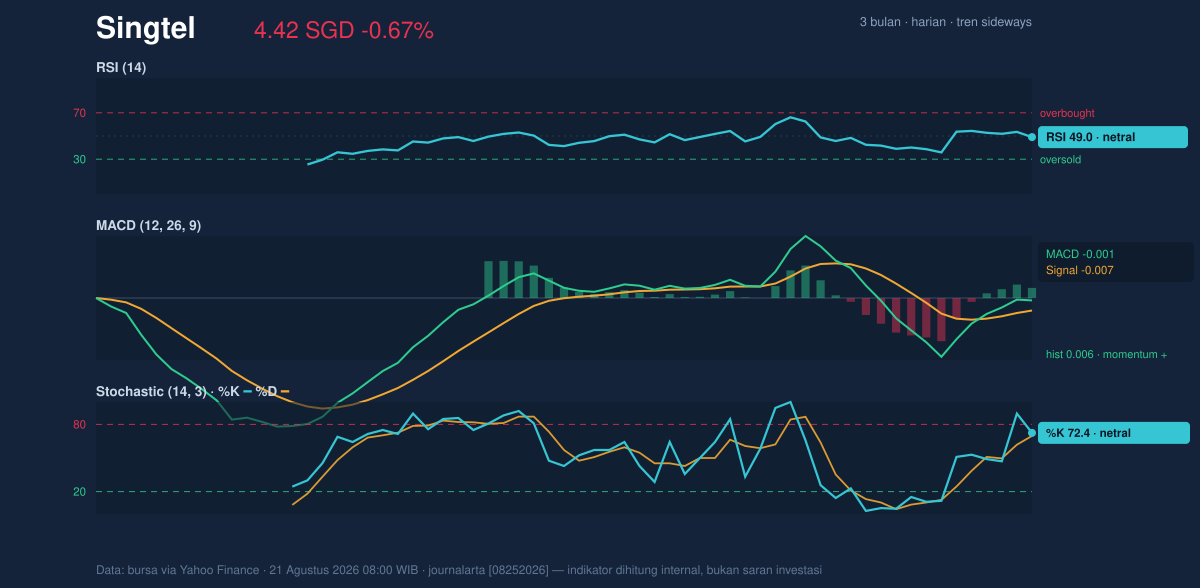
That gap between improving MACD and flat price action is important. It suggests the stock may be trying to base, but the move still needs participation and follow-through to become meaningful.
Volatility & Volume
Volatility is moderate, not explosive. ATR(14) at 0.08, or 1.9% of price, indicates the stock typically does not move in dramatic daily swings. For general readers, ATR is a measure of average daily movement, so this reading implies the name is currently behaving in a controlled, orderly way. That makes the current range more relevant: price is not being whipped around by panic or euphoria, which often means support and resistance levels can matter more than headline noise.
Volume, however, is the caution flag. The latest turnover of 18,475,200 shares is only 0.6× the 20-session average of 31,561,868, and OBV is falling. OBV, or on-balance volume, tracks whether volume is accumulating on up days or down days. A declining OBV while price holds near the middle of the range usually means participation is not yet confirming the price’s stability. In practical terms, the stock is not attracting enough fresh demand to validate a stronger move.
That is why the current setup looks more like consolidation than accumulation. The price is stable, momentum is improving modestly, but the crowd is not yet showing up in size.
Key Levels & Scenarios
The nearest support on the chart is 4.25, with resistance at 4.61. Those are the levels that define the current battle line. If the stock can push through 4.61 with better volume, it would signal that buyers are finally willing to pay above the recent ceiling. If it fails to hold 4.25, the market would be signaling that the floor of the recent range is no longer reliable.
The Bollinger structure adds another layer: 4.23 is the lower band and 4.59 the upper band. That means the price is still well within its expected trading corridor, and a move toward either edge would not be unusual. What would matter is whether price can close beyond the upper band and then stay there, because that would show the range is starting to expand in a directional way.
Technical Verdict: HOLD (wait & see)
- Reason 1: RSI at 49.0 is neutral, so there is no clear overbought or oversold signal.
- Reason 2: MACD histogram at 0.006 is positive, showing improving momentum, but the main MACD line is still just below zero, so confirmation is incomplete.
- Reason 3: Price above SMA20 at 4.41 and SMA50 at 4.40 is supportive, yet the flat trend and 0.6× volume mean the move lacks conviction.
- Verdict invalidated if price breaks below 4.25, which would weaken the current support structure and suggest the range is failing.
- Ideal Entry Range: 4.25 to 4.41
- Exit Target: 4.59 to 4.61
- Stop Loss protection: below 4.23
For non-traders: the shares are holding steady, but the market has not yet shown enough strength or volume to call the next move with confidence.
The latest 20-hour resistance level is 4.61.
Summary Data Singtel
| Last price | 4.42 SGD |
| Change 1 day / 5 days / 1 month | -0.67% / -0.67% / -0.90% |
| Trend / MA-cross | sideways / none |
| SMA20 / SMA50 | 4.41 / 4.40 |
| RSI (14) / Stochastic %K | 49.0 / 72.4 |
| Bollinger %B / ATR | 52% / 0.08 |
| Support / Resistance 20 days | 4.25 / 4.61 |
| Data as of | 21 Agustus 2026 08:00 WIB |
Track Singtel share price daily: live levels, support/resistance and our full Singtel analysis history.