Testing Support Level, HSBC Stock Gains 0.75% Today
On Agustus 25, 2026: price 161.50 HKD, trend sideways, RSI 56.0, support 160.10, resistance 168.20. technical analysis of hsbc stock. Testing Support Level —…
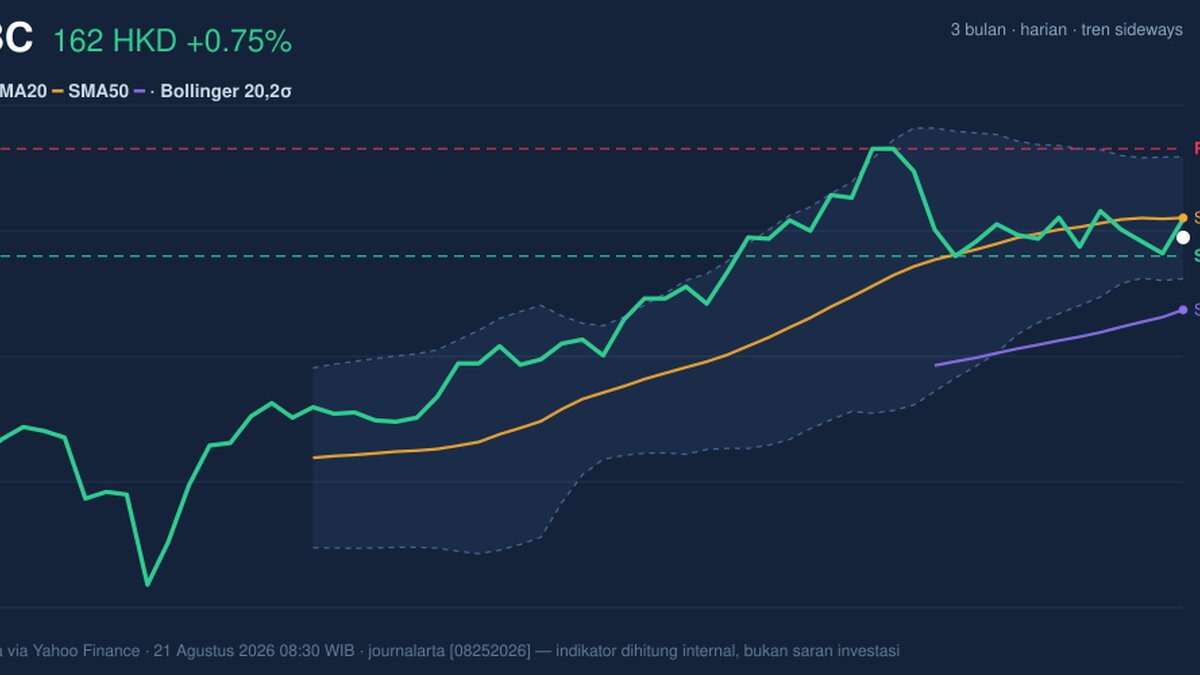
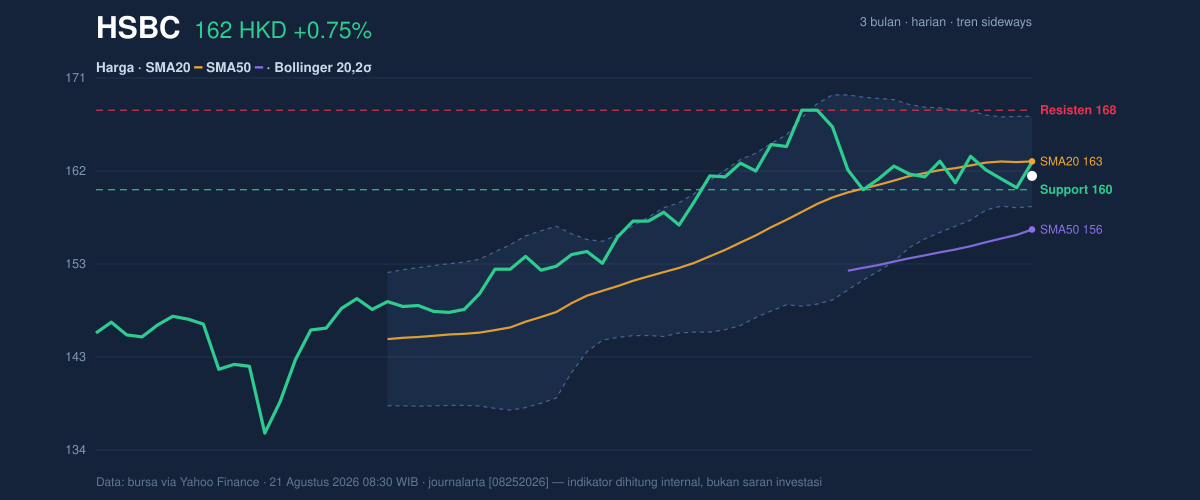
HSBC Holdings’ Hong Kong-listed shares closed at HKD 161.50, up 0.75% on the day, but the more important signal is that the stock is still trading below its SMA20 at HKD 162.98 even as the longer SMA50 at HKD 156.04 continues to sit underneath price. That combination points to a market that is not trending cleanly in either direction: the short-term tone has improved, yet the stock has not reclaimed enough momentum to break out of its recent range. As shown in the chart, HSBC is sitting in the middle of a narrowing band rather than pressing decisively toward either edge.
Trend & Price Action
The setup is best described as sideways, with the SMA20 slope only 0.43% over 5 days. That matters because a gentle upward slope usually tells traders that buyers are present, but not strong enough to force a new direction. The stock’s position relative to the moving averages is also telling: price is below the SMA20 but above the SMA50, which often signals a market caught between short-term hesitation and medium-term support. There is no fresh MA-cross, so there is no new moving-average confirmation of a trend shift.
The broader range reinforces that message. HSBC is trading well below its 3-month high of HKD 169.70 and above its 3-month low of HKD 133.50, while the latest close sits only 17% up the 20-hour range between support at HKD 160.10 and resistance at HKD 168.20. In plain terms, the stock is not under pressure, but it is also not showing the kind of force that would normally accompany a decisive advance.
Strong base, weak follow-through.
Oscillators & Momentum
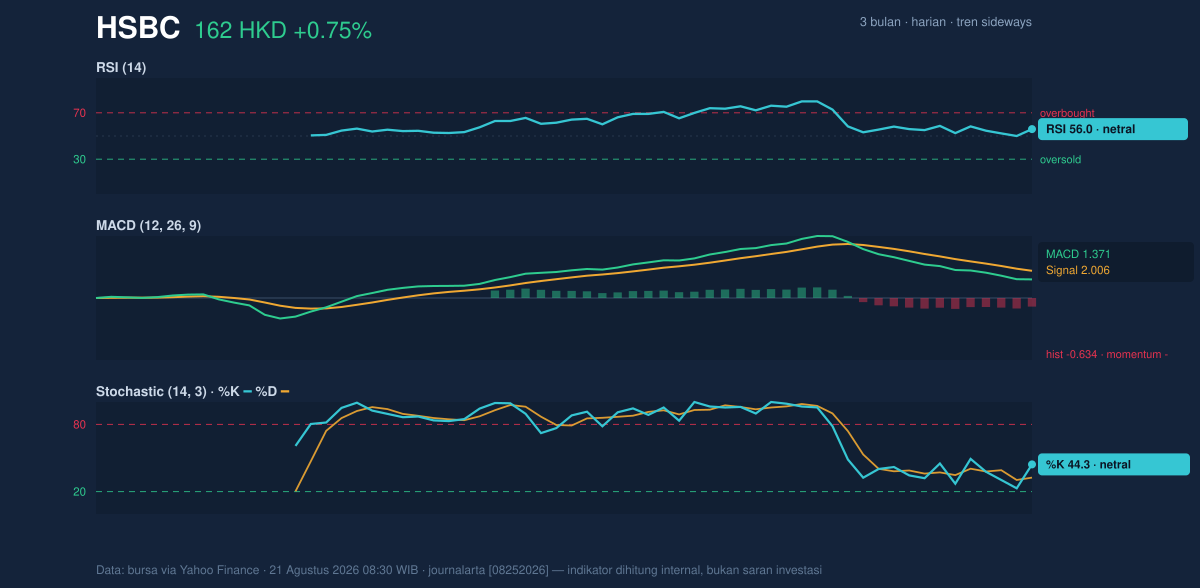
The momentum indicators are mixed, and that mix is important. RSI at 56.0 is neutral, which means the stock is neither stretched nor oversold. Stochastic %K at 44.3 and %D at 32.5 also sit in neutral territory, suggesting the recent rebound has not yet reached an overbought condition and still has room to extend if buyers step in. But the more cautionary signal comes from MACD at 1.371, below its signal line at 2.006, with a histogram of -0.634. For readers unfamiliar with the term, a negative histogram means the shorter-term momentum is lagging the trend line, so the market is still losing some upward force even if price has not broken down.
That divergence matters because it explains why the share can edge higher without building a convincing trend. The oscillators are not flashing distress, but the MACD says the move is not yet fully supported by momentum.
Volatility & Volume
The Bollinger Bands are tightening: the upper band is at HKD 167.59, the middle band at HKD 162.98, and the lower band at HKD 158.38, with band width at just 5.6%. That narrowing is a classic squeeze signal, which usually means the market is storing energy for a larger move. The key point is not direction, but compression: when volatility contracts, the next break can be sharper than the recent drift. The current %B of 34% shows price is sitting in the lower half of the band, which leans cautious without being bearish.
Volume does not yet confirm a breakout attempt. Last trading volume was 11,360,351, below the 20-day average of 13,093,349, or about 0.9x normal. That is a participation warning: price is moving, but not with enough turnover to prove conviction. The OBV is falling, which means the cumulative volume trend is not supporting the latest price action. In practical terms, the market is rising on less-than-full commitment, and that often leaves rallies vulnerable to fading unless volume improves.
The stock’s ATR(14) of 2.71, or 1.7% of price, says daily swings are moderate rather than explosive. Combined with the squeeze, that suggests the next meaningful move may come from an expansion out of a relatively calm base.
Key Levels & Scenarios
The nearest floor is HKD 160.10, and that level matters because it sits close to the current price. If HSBC holds above that area, the stock can continue to trade inside the current consolidation without damaging the broader structure. A clean move above HKD 162.98, the SMA20 and Bollinger middle band, would be the first sign that short-term momentum is improving. Above that, HKD 167.59 to HKD 168.20 becomes the key ceiling zone, where the upper Bollinger band and horizontal resistance converge.
If price fails to hold HKD 160.10, the market would likely revisit the lower band at HKD 158.38, with the SMA50 at HKD 156.04 acting as the next structural support. That would shift the tone from neutral consolidation to a more defensive setup.
Technical Verdict: HOLD (wait & see)
HOLD (wait & see)
- MACD is still below the signal line, with a -0.634 histogram, showing momentum has not fully turned positive.
- Price is below the SMA20 at HKD 162.98, so the short-term trend has not yet been reclaimed.
- Bollinger Bands are squeezing, which raises the odds of a larger move, but direction is not confirmed.
- Verdict invalidated if price falls below HKD 160.10, because that would break the nearest support and weaken the current base.
- Ideal Entry Range: HKD 160.10–162.98
- Exit Target: HKD 167.59–168.20
- Stop Loss Protection: below HKD 158.38
For non-traders: HSBC is drifting inside a tight range, and the next clear move will likely come only after price leaves the HKD 160.10 to HKD 168.20 band.
Summary Data HSBC
| Last price | 161.50 HKD |
| Change 1 day / 5 days / 1 month | 0.75% / 0.44% / 0.06% |
| Trend / MA-cross | sideways / none |
| SMA20 / SMA50 | 162.98 / 156.04 |
| RSI (14) / Stochastic %K | 56.0 / 44.3 |
| Bollinger %B / ATR | 34% / 2.71 |
| Support / Resistance 20 days | 160.10 / 168.20 |
| Data as of | 21 Agustus 2026 08:30 WIB |
Track HSBC share price daily: live levels, support/resistance and our full HSBC analysis history.