AIA Stock Technicals Today: Gains 1.14%, Death Cross Pressure
On Agustus 31, 2026: price 75.50 HKD, trend sideways, RSI 53.2, support 70.40, resistance 78.55. technical analysis of aia stock. AIA Stock Technicals — full…
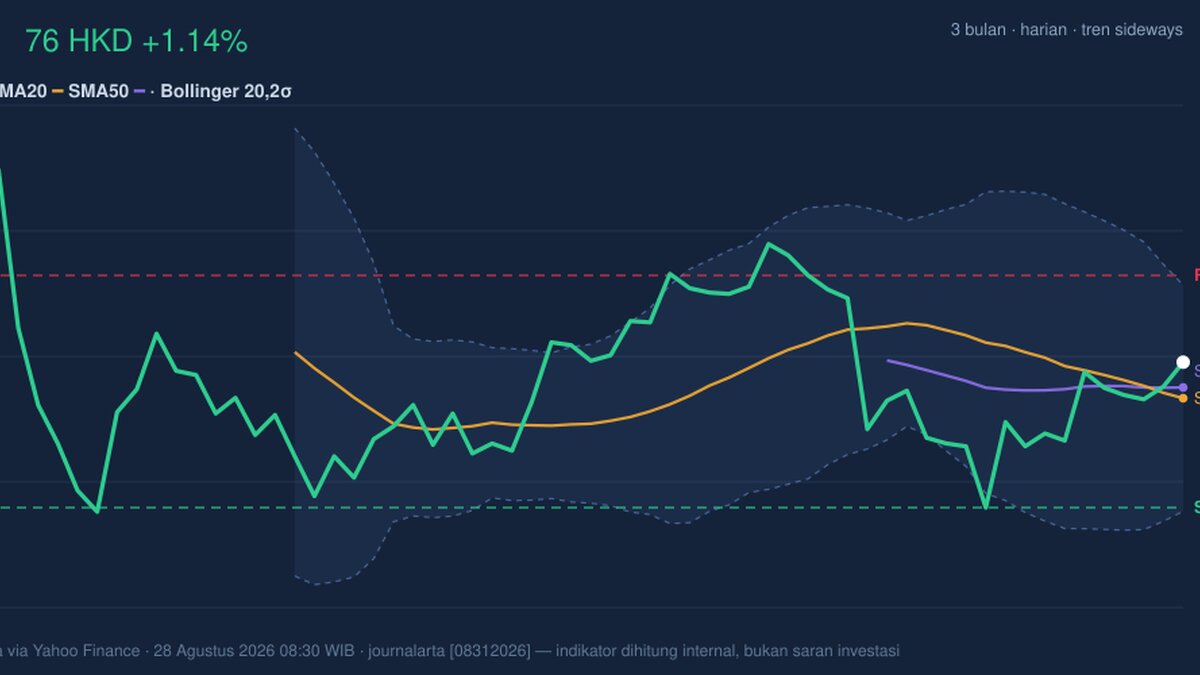
AIA Group’s shares rose to 75.50 HKD in Hong Kong trading, up 1.14% on the day, but the move sits inside a broader pattern that still looks cautious rather than decisive. As shown in the chart, the stock is trading above the 20-day moving average at 74.24 and slightly above the 50-day moving average at 74.62, yet the medium-term setup is clouded by a death cross, where the shorter average has slipped below the longer one. That combination matters: it says the latest bounce has enough strength to reclaim nearby trend lines, but the longer trend has not fully turned.
Trend & Price Action
The share price is in a sideways trend, and the slope of the 20-day average, at -1.30% over five days, shows that recent momentum has not been strongly upward. The stock is now sitting in the upper half of its near-term range, at about 63% of the way from support to resistance, which suggests buyers have regained some control without yet forcing a breakout. That positioning is important because it often reflects a market that is testing whether the recent recovery can become something more durable.
The broader range also frames the move. AIA’s 3-month high stands at 84.20 and the 3-month low at 69.05, so the current price is still well below the top of that band and comfortably above the lower end. In plain terms, the stock has bounced off the weaker part of its range, but it has not yet proven that it can leave the middle ground behind.
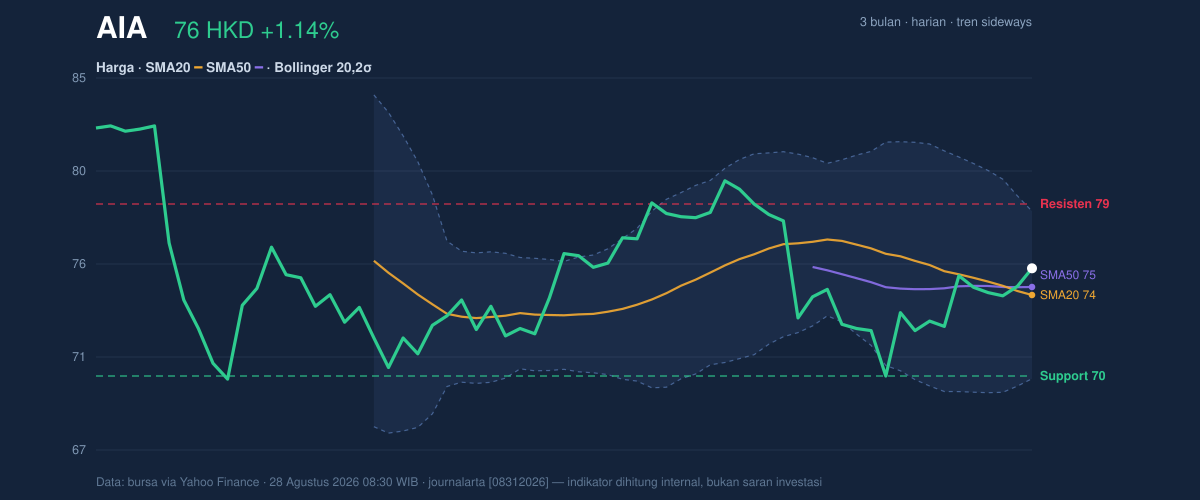
The Bollinger Band structure reinforces that reading. Price is below the upper band at 78.21 and above the middle band at 74.24, with %B at 66%. That means the share is leaning toward the stronger side of the range, but not in a stretched condition. The band width is 10.7%, described as normal, which signals that volatility is neither compressed into a breakout setup nor expanded into a panic move. In other words, the market is moving, but not violently.
Oscillators & Momentum
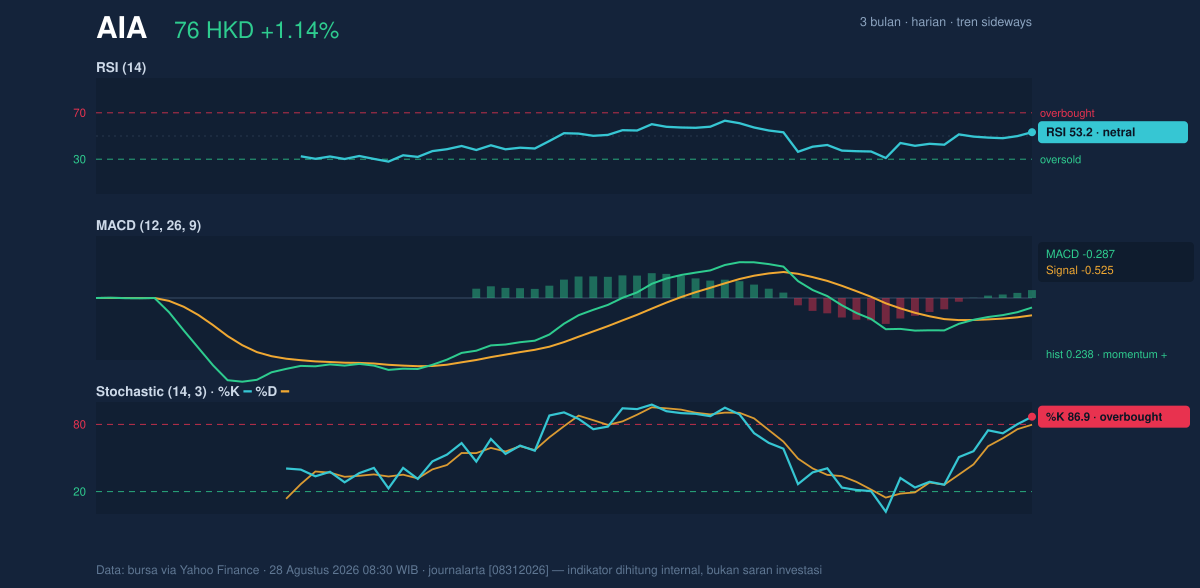
The momentum picture is mixed, and that mix is the main reason the chart still reads as a wait-and-watch setup. The RSI at 53.2 is neutral, which usually means neither buyers nor sellers have a decisive edge. That is not a bearish signal by itself. It simply says the stock is not overextended and still has room to move in either direction.
The Stochastic oscillator is overbought, with %K at 86.9 and %D at 79.7. This matters because stochastic tends to react faster than RSI, so when it enters overbought territory while the broader trend is still only sideways, it often warns that the latest rise may be getting ahead of itself. That does not guarantee a reversal. It does suggest the rally may need a pause or a retest before extending.
The MACD picture is more constructive. With MACD at -0.287, the signal line at -0.525, and a positive histogram of 0.238, short-term momentum has improved enough to move above its signal line. This is a useful confirmation that the rebound has some internal strength. But because the MACD is still below zero, the longer momentum backdrop has not fully shifted into a clean bullish phase. That is why the chart shows improvement without full conviction.
Volatility & Volume
AIA’s ATR of 1.87, equal to 2.5% of the share price, points to moderate volatility. For readers unfamiliar with the term, ATR measures how much a stock typically moves in a session; here, it suggests the shares can still travel meaningfully in either direction, but not in a disorderly way. That leaves room for a test of nearby levels if volume supports it.
The volume signal is less supportive. Last trade volume was 26,471,858, below the 20-session average of 33,095,415, or about 0.8× normal. Lower-than-average participation often means the move is not yet being broadly confirmed by the market. The OBV is falling, which is another caution flag because on-balance volume tracks whether trading activity is accumulating into strength or quietly leaking away. When price rises but OBV falls, the rally can be vulnerable to fading once traders stop chasing it.
Key Levels & Scenarios
The nearest technical floor is 70.40, the 20-session support level. Below that sits the broader low of 69.05, which is the next important reference from the 3-month range. On the upside, 78.55 is the 20-session resistance level, closely aligned with the Bollinger upper band at 78.21. That clustering makes the area especially important: if the stock clears it with better volume, the chart would begin to look less like a rebound and more like a range breakout attempt.
At the moment, the message is conditional. If price holds above 74.24 and continues to improve with MACD support, the stock can keep probing toward 78.21 to 78.55. If it loses 70.40, the chart would shift back toward the lower end of the range, where the 69.05 low becomes the next technical magnet.
Technical Verdict: HOLD (wait & see)
HOLD (wait & see) fits the current setup best because the chart has recovered above key averages, but the broader trend is still sideways and the volume confirmation is weak.
- Reason 1: MACD is positive, with the histogram above zero, showing improving short-term momentum.
- Reason 2: Stochastic is overbought, which warns the recent bounce may be mature unless fresh buying appears.
- Reason 3: Volume is below average and OBV is falling, so the price rise has not yet been backed by convincing participation.
- Verdict invalidated if price falls below 70.40, the 20-session support level.
- Ideal Entry Range: 74.24 to 74.62
- Exit Target: 78.21 to 78.55
- Stop Loss Protection: below 70.40, with 69.05 as the deeper technical line
In plain English, the chart says AIA has recovered, but it has not yet proved that the recovery is strong enough to trust without caution.
Summary Data AIA
| Last price | 75.50 HKD |
| Change 1 day / 5 days / 1 month | 1.14% / 0.47% / -4.73% |
| Trend / MA-cross | sideways / death |
| SMA20 / SMA50 | 74.24 / 74.62 |
| RSI (14) / Stochastic %K | 53.2 / 86.9 |
| Bollinger %B / ATR | 66% / 1.87 |
| Support / Resistance 20 days | 70.40 / 78.55 |
| Data as of | 28 Agustus 2026 08:30 WIB |
Track AIA share price daily: live levels, support/resistance and our full AIA analysis history.