Sembcorp Stock Drops 0.66% on Wednesday, Death Cross Pressure
On October 14, 2026: price 6.04 SGD, trend sideways, RSI 57.5, support 5.79, resistance 6.08. technical analysis of sembcorp stock. Sembcorp Stock Drops — full…
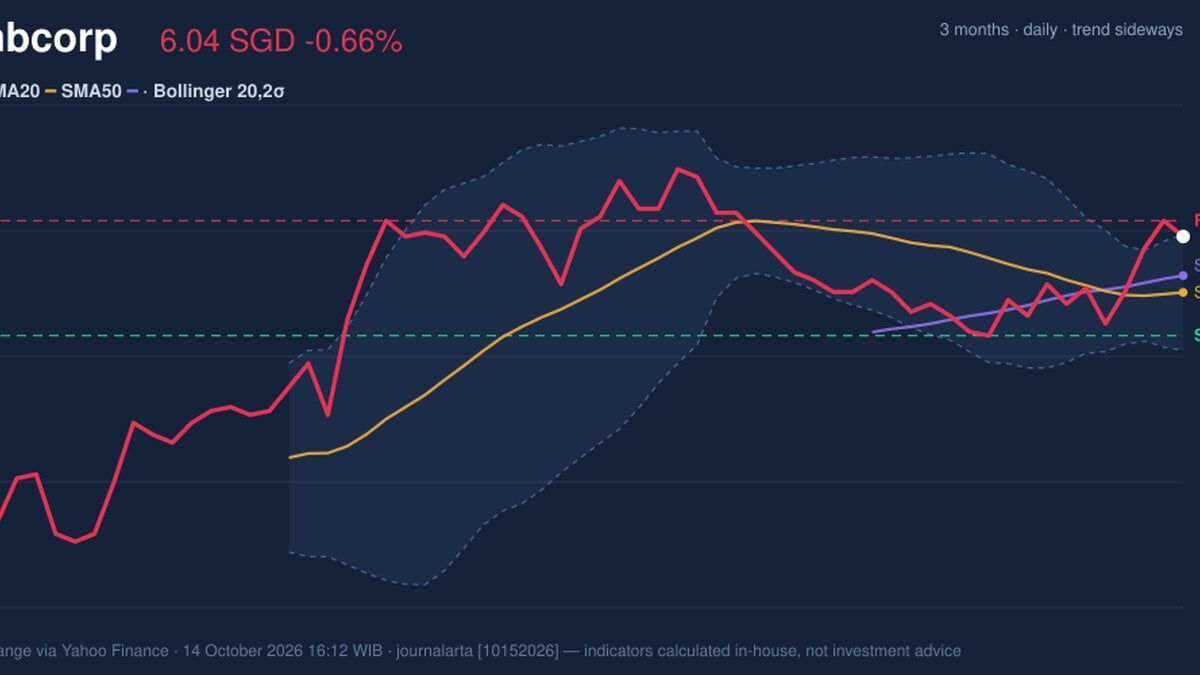
Why Sembcorp is in focus today
- Fresh death cross: SMA20 crossed below SMA50
Selected automatically from 16 SGX (Singapore) stocks by a technical-signal score with daily weighted randomisation — not a recommendation.
Trend & Price Action
Sembcorp is trading above its 20-day simple moving average (SMA) of S$5.90, but below its 50-day SMA of S$5.94. The 20-day average has crossed below the 50-day average, a pattern known as a death cross and often read as a sign that shorter-term momentum has weakened relative to the broader trend. Here, the averages are close together and the 20-day SMA’s slope is slightly negative, so the cross is a caution signal rather than proof of a sustained decline. The share price is 86% of the way through its 20-day range, close to the S$6.08 resistance level. That leaves limited room before a near-term test of resistance, while S$5.79 support marks the lower boundary of the range. Sembcorp’s three-month high and low are S$6.22 and S$5.22, respectively. The price is above its 20-day average, but the death cross and nearby resistance leave the trend without clear confirmation. The chart shows how the price sits against the moving averages, Bollinger bands and key levels.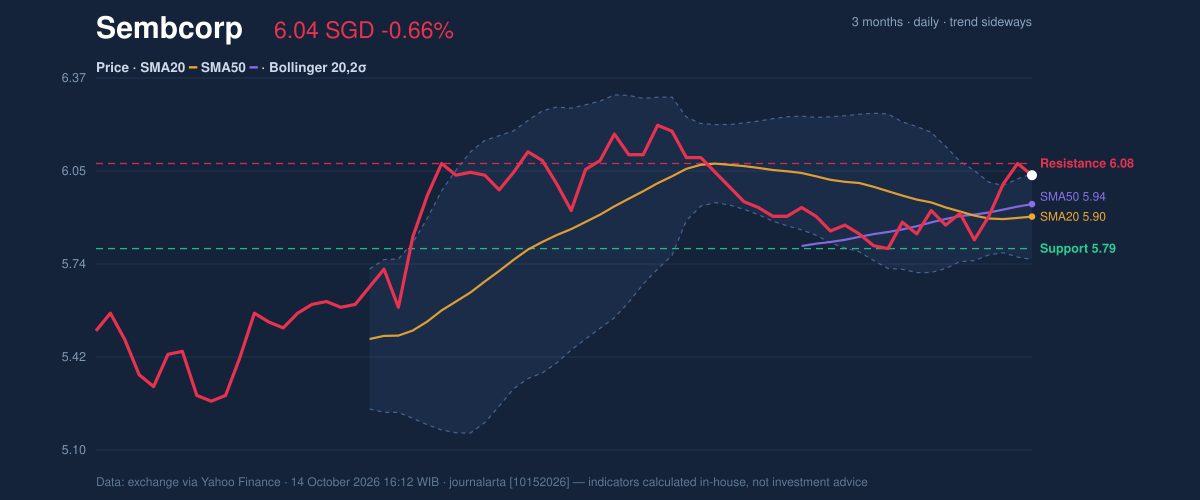
Momentum & Volatility
Momentum is positive but not forceful. The MACD, a measure comparing short- and longer-term price momentum, is above its signal line, with a positive histogram. That supports the possibility of further near-term strength, but it does not erase the bearish message of the moving-average cross. The RSI is 57.5, a neutral reading that indicates neither extreme buying nor selling pressure. Stochastic %K is 69.8 and %D is 83.4; both remain in a broadly neutral zone, though the lower %K suggests momentum has eased relative to its signal. RSI is neutral, Stochastic is neutral, and MACD momentum is positive. The indicators are therefore mixed, rather than aligned behind a single directional move. The chart below displays RSI, MACD and Stochastic.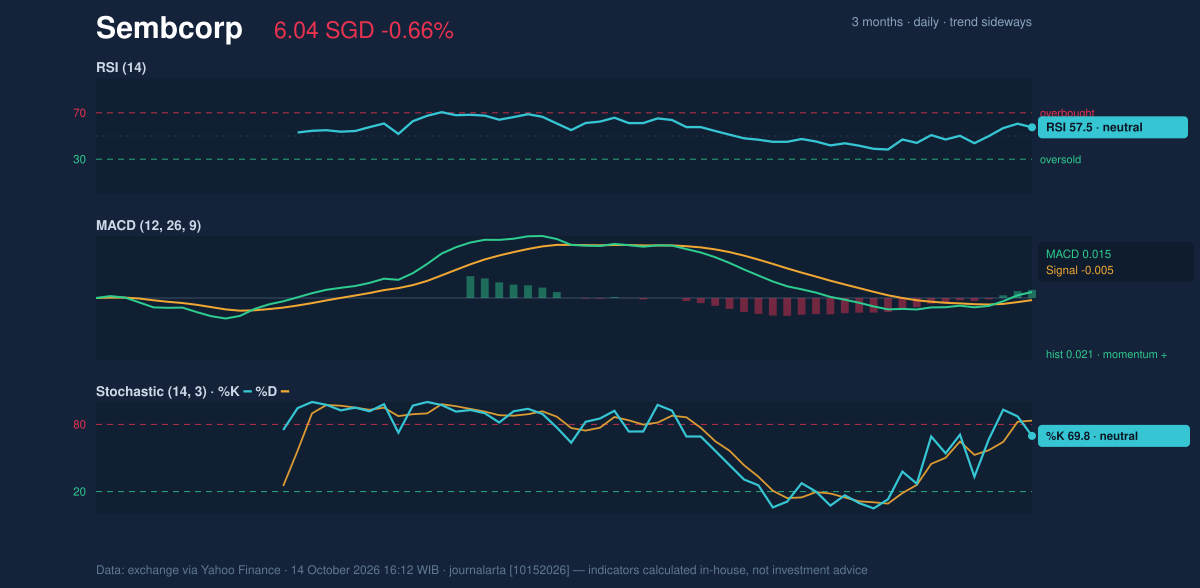
Key Levels & Scenarios
A move above S$6.08 resistance would clear the top of the 20-day range; the three-month high at S$6.22 is the next reference level in the supplied data. If the price fails to hold and falls through S$5.79 support, the recent range would be breaking downward. The squeeze raises the chance of an expansion in movement, but the indicators do not specify which direction that move will take.Technical Verdict: HOLD (wait & see)
The technical picture is balanced: the death cross and slightly declining SMA20 argue for caution, while positive MACD and rising OBV provide counter-signals. The narrow Bollinger bands point to a potential breakout, but price is already near resistance and volume remains below its 20-day average. - Ideal entry range: S$5.90–S$5.94, around the 20-day and 50-day SMAs. - Exit target: S$6.08–S$6.22, spanning 20-day resistance and the three-month high. - Stop-loss protection: S$5.75, the lower Bollinger band; the verdict is invalidated if price falls below S$5.79 support. In plain English, the indicators do not yet show whether Sembcorp is more likely to break higher or retreat from resistance.| Market data | Reading |
|---|---|
| Last price | S$6.04 |
| Daily change | -0.66% |
| Five-day change | +2.20% |
| SMA20 / SMA50 | S$5.90 / S$5.94 |
| 20-day support / resistance | S$5.79 / S$6.08 |
| Source | Exchange data via Yahoo Finance, 14 October 2026, 16:12 WIB |
Summary Data Sembcorp
| Last price | 6.04 SGD |
| Change 1 day / 5 days / 1 month | -0.66% / 2.20% / 1.51% |
| Trend / MA-cross | sideways / death |
| SMA20 / SMA50 | 5.90 / 5.94 |
| RSI (14) / Stochastic %K | 57.5 / 69.8 |
| Bollinger %B / ATR | 98% / 0.12 |
| Support / Resistance 20 days | 5.79 / 6.08 |
| Data as of | 14 October 2026 16:12 WIB |
Disclaimer: This technical analysis is generated automatically from exchange data (via Yahoo Finance) and indicators calculated by JournalArta, for information and education only. The verdict and the entry, target and stop-loss levels are not investment advice or a solicitation to buy or sell any security. Investment decisions and their risks rest solely with the reader.
Track Sembcorp share price daily: live levels, support/resistance and our full Sembcorp analysis history.