Meituan Stock Analysis: Gains 6.64%, Testing Key Resistance
On October 14, 2026: price 77.10 HKD, trend sideways, RSI 60.1, support 69.40, resistance 77.10. technical analysis of meituan stock. Meituan Stock Analysis —…
Trend & Price Action
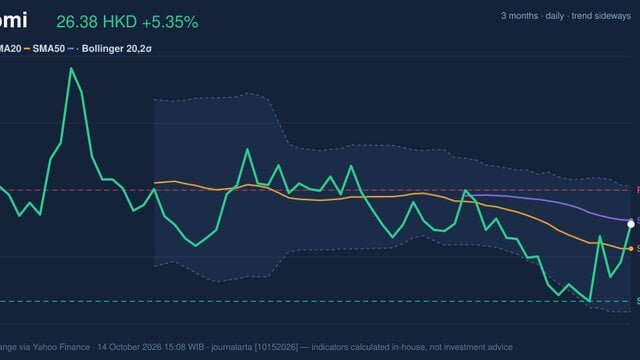
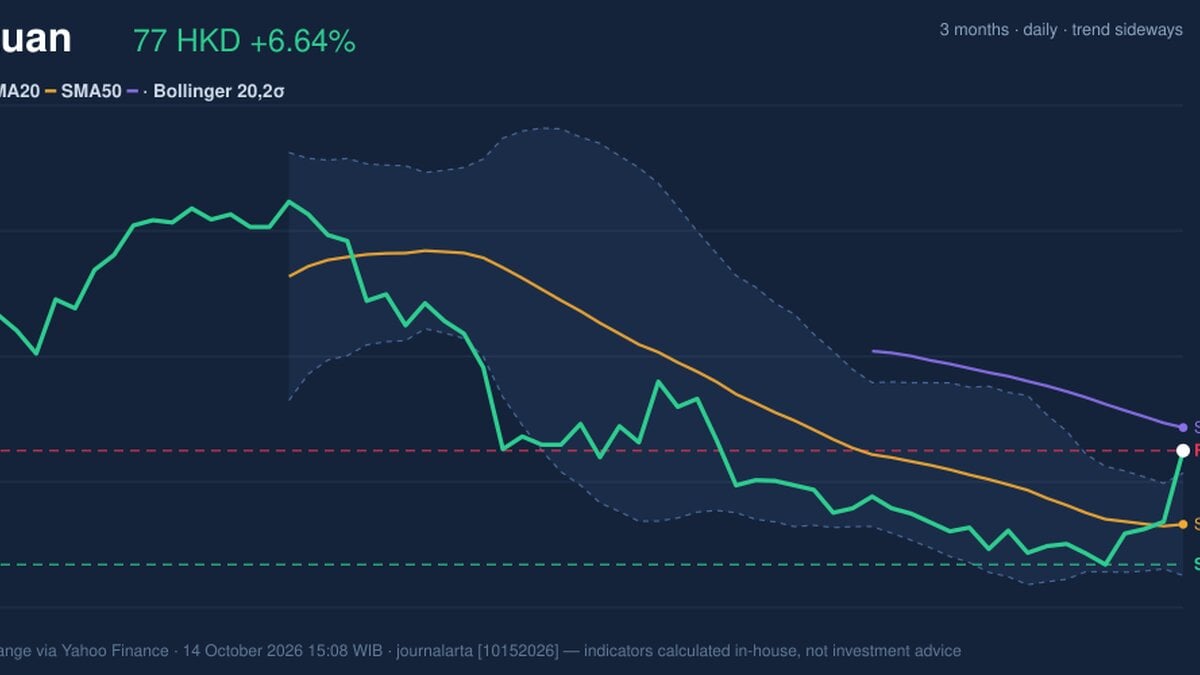
The share price rose 9.91% over five days and 3.14% over one month, yet the broader technical trend remains sideways. The 20-day simple moving average (SMA)—an average closing price over that period—has a downward slope of 1.05% over five days. Meituan is trading above that average at HK$72.12, but below its 50-day SMA at HK$78.66. The price rebound is therefore meaningful, but has not yet shifted the longer average-price signal in its favour. No new crossover between the averages has formed. The latest close of HK$77.10 is above the upper Bollinger Band at HK$75.58. Bollinger Bands track a moving average and its usual price variation; a move beyond the upper band can signal strong momentum, but also shows that price has stretched beyond its recent typical range. The band width is 9.6%, described as normal rather than unusually compressed or expanded. The close also matches resistance for the past 20 trading days, placing the share at the top of that range. The three-month high and low are HK$96.45 and HK$68.80. That wider range gives context to the rebound: the stock has recovered from near the lower end, but remains well below its three-month high.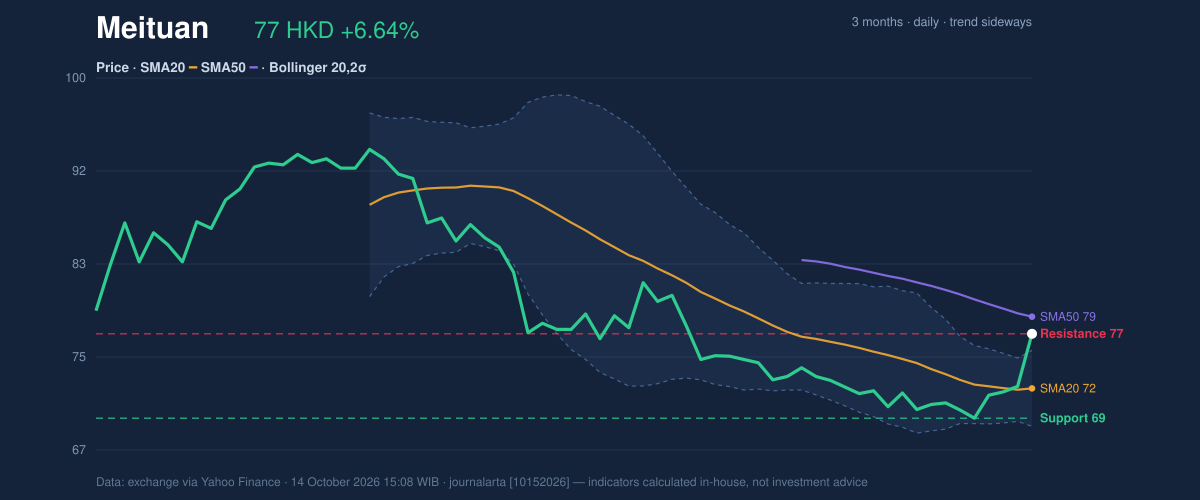
Oscillators & Momentum
Momentum indicators are positive, though not uniformly comfortable. The 14-day Relative Strength Index (RSI), which gauges the pace of recent gains and losses, is 60.1, a neutral reading rather than an extreme. The Stochastic oscillator compares the latest close with its recent price range: %K is 96.0 and %D is 69.9. Stochastic %K is overbought, warning that the rally may be vulnerable to a pause or pullback. The MACD is still below zero at -1.376, but stands above its signal line at -2.223; its histogram is positive at 0.846. That positive MACD configuration signals improving momentum, even though the indicator has not crossed into positive territory. Read together, the indicators suggest a strong short-term rebound rather than confirmation that the broader sideways trend has fully turned upward.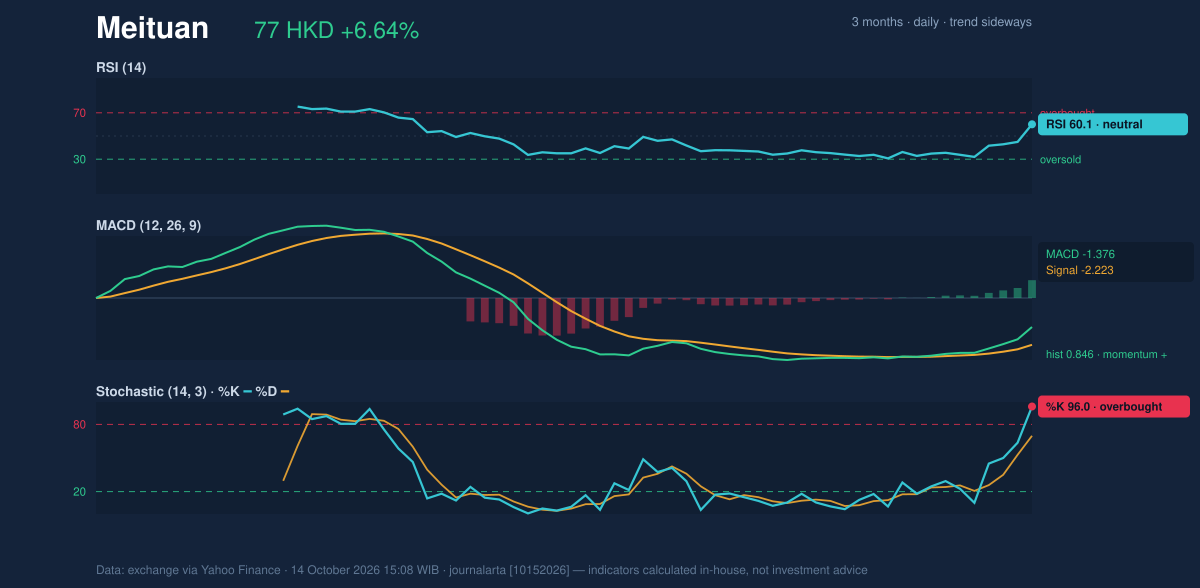
Volatility, Volume & Key Levels
Trading volume reached 65,472,606 shares, compared with a 20-day average of 22,860,501. OBV, or On-Balance Volume, which combines price direction with trading volume to track buying and selling pressure, is rising. The volume surge and rising OBV support the rally’s credibility: the move was accompanied by heavier participation, not merely a small-volume price jump. The 14-day Average True Range (ATR), a measure of typical daily price movement, is HK$2.26, or 2.9% of the share price—moderate volatility by the supplied data. The 20-day support is HK$69.40, while resistance is HK$77.10. A sustained move above that resistance could extend the breakout; failure to hold above it would put the recent surge at risk of fading back into the range. Support at HK$69.40 is the key downside reference; the immediate resistance is the level reached at the latest close.Technical Verdict: HOLD (wait & see)
The indicators point to a sharp, volume-backed rebound, but the share is at 20-day resistance, above the upper Bollinger Band and below its 50-day average. That mix supports a cautious, conditional verdict rather than a clear directional signal.- Ideal entry range: HK$72.12–HK$75.58, using the 20-day SMA and upper Bollinger Band as reference levels.
- Exit target: HK$78.66, the 50-day SMA, which is the next supplied reference above resistance.
- Stop-loss protection: HK$69.40, the 20-day support level.
At the latest reading, Meituan traded at HK$77.10.
Why Meituan is in focus today
- One-day move of 6.64%, about 2.3× its average daily range (ATR)
- Volume at 2.9× the 20-day average
- Closed at a 20-day high (77.10)
Selected automatically from 16 HKEX (Hong Kong) stocks by a technical-signal score with daily weighted randomisation — not a recommendation.
Summary Data Meituan
| Last price | 77.10 HKD |
| Change 1 day / 5 days / 1 month | 6.64% / 9.91% / 3.14% |
| Trend / MA-cross | sideways / none |
| SMA20 / SMA50 | 72.12 / 78.66 |
| RSI (14) / Stochastic %K | 60.1 / 96.0 |
| Bollinger %B / ATR | 122% / 2.26 |
| Support / Resistance 20 days | 69.40 / 77.10 |
| Data as of | 14 October 2026 15:08 WIB |
Disclaimer: This technical analysis is generated automatically from exchange data (via Yahoo Finance) and indicators calculated by JournalArta, for information and education only. The verdict and the entry, target and stop-loss levels are not investment advice or a solicitation to buy or sell any security. Investment decisions and their risks rest solely with the reader.
Track Meituan share price daily: live levels, support/resistance and our full Meituan analysis history.