RSI Oversold, CapitaLand Investment Stock Drops 0.41% on Wednesday
On October 14, 2026: price 2.41 SGD, trend downtrend, RSI 27.0, support 2.41, resistance 2.64. technical analysis of capitaland investment stock.
Trend & Price Action
The stock is at the bottom of its 20-day trading range, between support at S$2.41 and resistance at S$2.64. The three-month range, from S$2.39 to S$2.80, shows how little room remains before the recent low is tested. Holding near S$2.39–S$2.41 would matter because it would suggest buyers are defending the lower end of the range; a break beneath that area would weaken that case. As shown in the chart, the price is near the lower Bollinger Band at S$2.37, while the middle band sits at S$2.53. Bollinger Bands track how far a price has moved relative to its recent average: the current 12% position within the bands places the shares near the lower edge, not in the middle of their recent range. The band width is 12.7%, described as normal, so the data do not indicate an unusually tight volatility squeeze or a major expansion.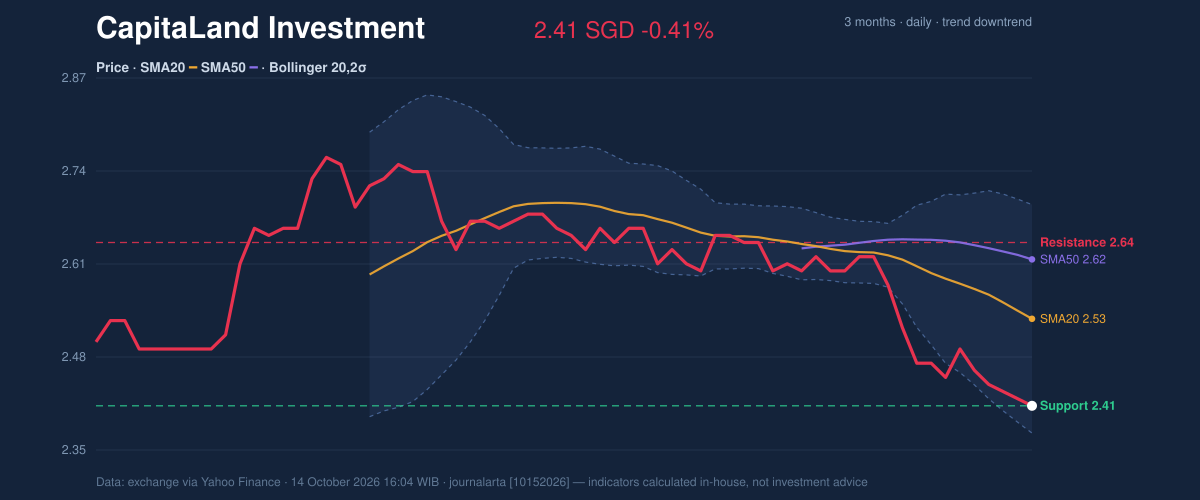
Oscillators & Momentum
Momentum indicators confirm the pressure but also show that the decline has become extended. RSI at 27.0 is oversold, while Stochastic readings of 8.0 and 7.8 are also oversold. These measures compare recent losses with earlier price movements; low readings can signal that selling has been intense, but they do not establish that a rebound has begun. The MACD remains negative at -0.056, below its -0.043 signal line, with a negative histogram of -0.012. That alignment points to continuing downward momentum, rather than a confirmed reversal. The distinction matters: oversold readings describe the depth of the decline, while the MACD suggests that downward pressure has not yet eased.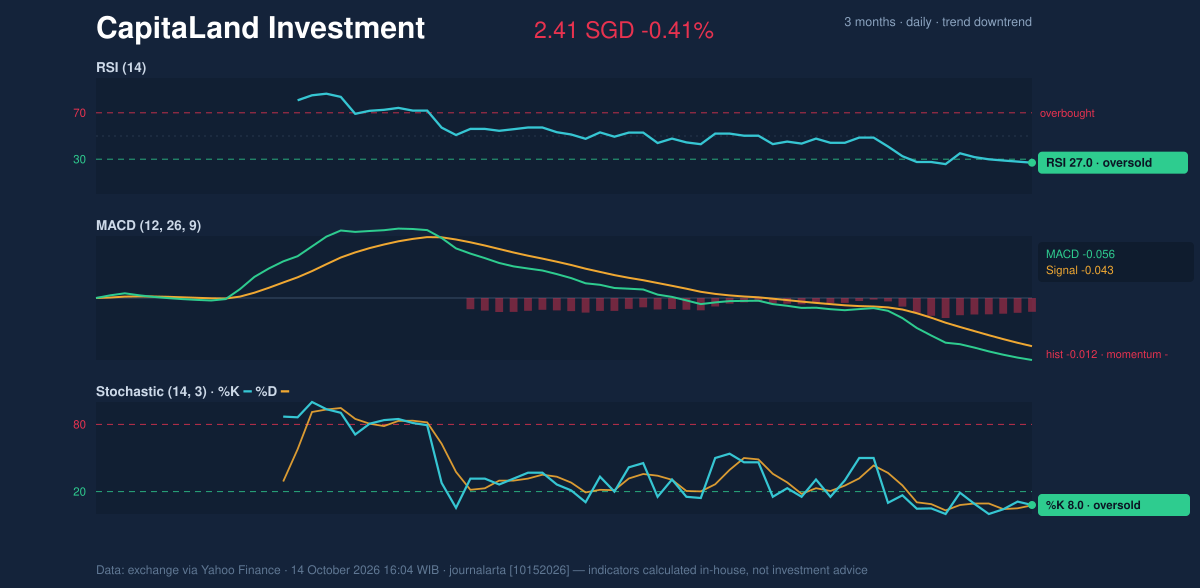
Volatility, Volume & Key Levels
Trading volume was 7,306,400 shares, about 0.7 times the 20-day average of 10,780,635, while the on-balance volume (OBV) indicator was falling. OBV uses trading volume to track whether activity is accumulating on rising days or weakening on falling days. Its decline, alongside below-average turnover, gives little evidence of broad buying participation at the low. Average true range (ATR), a measure of typical price movement, stands at S$0.05, or 2.1% of the share price—moderate volatility by the supplied data. S$2.39 is the immediate downside reference, just below the S$2.41 20-day support; the lower Bollinger Band at S$2.37 is another chart level. On a recovery, S$2.53 (the 20-day SMA) is the first significant hurdle, followed by S$2.62–S$2.64, where the 50-day SMA and 20-day resistance converge. A move above that zone would improve the technical picture; failure to hold the recent lows would worsen it.Technical Verdict: HOLD (wait & see)
The indicators support a cautious, conditional reading rather than a confirmed turn. The verdict is HOLD (wait & see): the shares are oversold, but the trend and momentum remain negative.- Ideal entry range: S$2.39–S$2.41, the three-month low and 20-day support area, subject to the price holding that zone.
- Exit target: S$2.53–S$2.64, spanning the 20-day SMA and the 50-day SMA/20-day resistance area.
- Stop-loss protection: S$2.37, the lower Bollinger Band, as a chart-based reference below nearby support.
Data table
Why CapitaLand Investment is in focus today
- Closed at a 20-day low (2.41)
- Trading near its 3-month low (2.39)
- RSI(14) at 27.0 — oversold zone
- Downtrend extending (5-day change -3.21%)
Selected automatically from 16 SGX (Singapore) stocks by a technical-signal score with daily weighted randomisation — not a recommendation.
| Indicator | Reading |
|---|---|
| Last price | S$2.41 |
| Change | -0.41% (1 day); -3.21% (5 days); -8.71% (1 month) |
| SMA20 / SMA50 | S$2.53 / S$2.62 |
| Bollinger Bands | Upper S$2.69; middle S$2.53; lower S$2.37; %B 12%; width 12.7% |
| RSI / Stochastic | 27.0 / 8.0 and 7.8 |
| MACD / signal / histogram | -0.056 / -0.043 / -0.012 |
| ATR | S$0.05 (2.1%) |
| Volume / 20-day average | 7,306,400 / 10,780,635 |
| Support / resistance (20-day) | S$2.41 / S$2.64 |
| Three-month high / low | S$2.80 / S$2.39 |
Summary Data CapitaLand Investment
| Last price | 2.41 SGD |
| Change 1 day / 5 days / 1 month | -0.41% / -3.21% / -8.71% |
| Trend / MA-cross | downtrend / none |
| SMA20 / SMA50 | 2.53 / 2.62 |
| RSI (14) / Stochastic %K | 27.0 / 8.0 |
| Bollinger %B / ATR | 12% / 0.05 |
| Support / Resistance 20 days | 2.41 / 2.64 |
| Data as of | 14 October 2026 16:04 WIB |
Disclaimer: This technical analysis is generated automatically from exchange data (via Yahoo Finance) and indicators calculated by JournalArta, for information and education only. The verdict and the entry, target and stop-loss levels are not investment advice or a solicitation to buy or sell any security. Investment decisions and their risks rest solely with the reader.
Track CapitaLand Investment share price daily: live levels, support/resistance and our full CapitaLand Investment analysis history.