Xiaomi Momentum Gains: Stock Gains 5.35% (October 14, 2026)
On October 14, 2026: price 26.38 HKD, trend sideways, RSI 53.7, support 23.66, resistance 27.58. technical analysis of xiaomi stock. Xiaomi Momentum Gains —…
Trend & Price Action
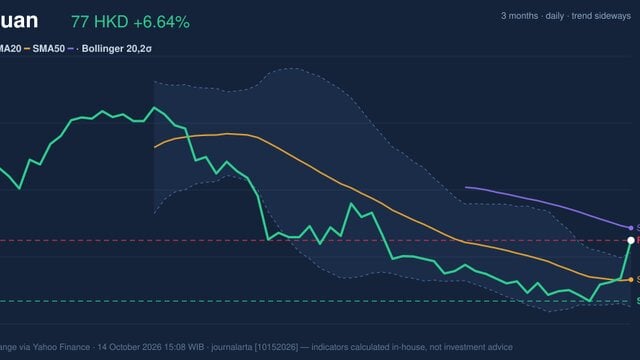
Xiaomi closed above its 20-day simple moving average (SMA) of HK$25.52, but just below its 50-day average of HK$26.51. That split suggests short-term improvement without confirmation from the longer average. There has been no new moving-average crossover, and the 20-day average is still sloping down, by 1.31% over five trading days. The stock has gained 10.19% over five days, while its one-month change remains a slight decline of 0.45%. That contrast points to a recent rebound rather than a fully repaired trend. Xiaomi is also still well below its three-month high of HK$32.40, though above the period low of HK$23.58. As shown in the chart, the price is within the Bollinger Bands, whose upper boundary is HK$27.74 and lower boundary is HK$23.29. The bands’ normal width offers no clear squeeze signal—typically a sign of unusually subdued volatility that may precede a larger move. Xiaomi’s position at 69% of its 20-day support-to-resistance range leaves room before the top, but puts HK$27.58 resistance in focus.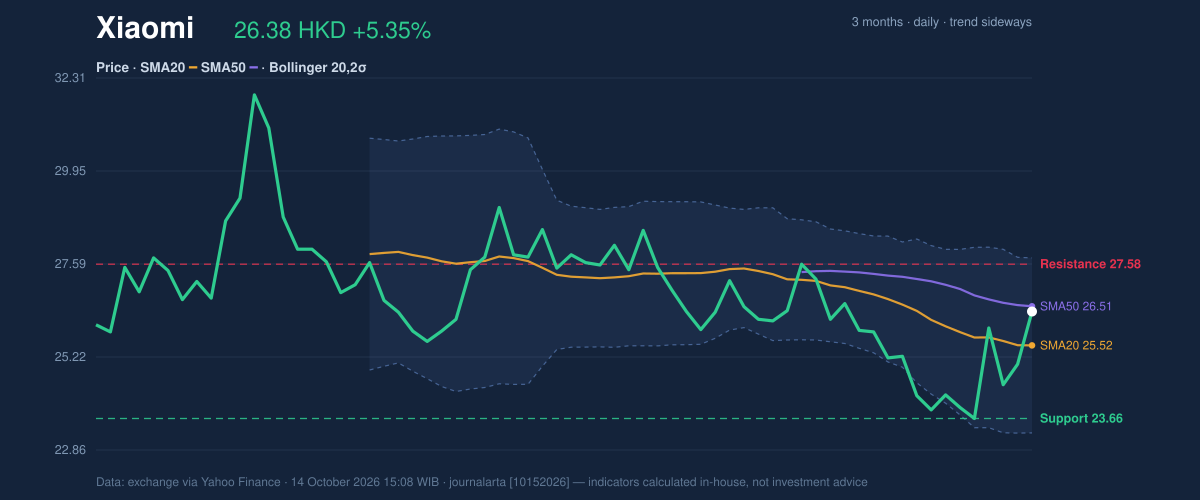
Oscillators & Momentum
The momentum picture is improving, but not uniformly. The MACD histogram is positive at 0.125, with MACD at -0.474 above its -0.599 signal line. The crossover indicates that downward momentum has eased; because both lines remain below zero, it is not by itself evidence of a confirmed longer-term uptrend. The RSI is neutral at 53.7, consistent with a market that has recovered without reaching an extreme. Stochastic %K, however, is overbought at 85.9, compared with %D at 48.5. This faster-moving measure suggests the recent advance may be stretched in the short term, increasing the possibility of pauses or pullbacks.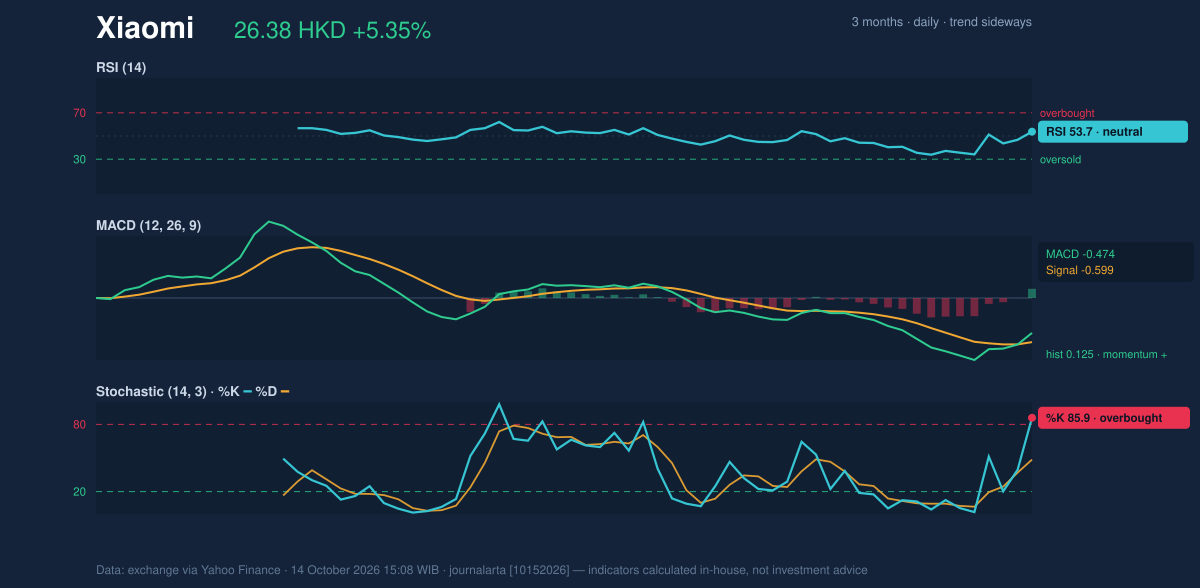
Volatility, Volume & Key Levels
Volume reached 277.5 million shares, compared with a 20-day average of 125.8 million, while on-balance volume (OBV) rose. That pairing supports the view that the rally attracted meaningful participation rather than occurring on thin turnover. It is a constructive confirmation, though one session’s activity cannot establish whether buyers will persist. The day’s gain was about 1.3 times the average daily range indicated by ATR, which stands at HK$1.10, or 4.2% of the share price. That is high volatility: price swings can be substantial even when the broader trend is sideways. The nearest stated resistance is HK$27.58, with the upper Bollinger Band at HK$27.74. A move through that area would test whether the volume-backed rebound can extend. On the downside, HK$23.66 is the 20-day support; falling below it would weaken the rebound case. The three-month low of HK$23.58 is a separate reference point, not a guarantee that support will hold.Technical Verdict: HOLD (wait & see)
Core view: Xiaomi’s momentum has turned constructive, but resistance, a falling 20-day average and overbought Stochastic readings keep the technical picture unconfirmed. - Reasons: the MACD histogram has turned positive; volume is 2.2 times its 20-day average and OBV is rising; the price is above SMA20 but still below SMA50. - Invalidation: this verdict is invalidated if the price falls below HK$23.66, the stated 20-day support. - Reference entry range: HK$25.52–HK$26.51, bounded by SMA20 and SMA50. - Reference exit target: HK$27.58–HK$27.74, the stated resistance and upper Bollinger Band. - Reference stop-loss protection: below HK$23.66, the stated 20-day support. In plain English, Xiaomi’s rebound has signs of real momentum, but the chart has not yet confirmed that it can overcome resistance and sustain the move.Data source: HKEX market data via Yahoo Finance, as of 14 October 2026, 15:08 WIB.
Why Xiaomi is in focus today
- One-day move of 5.35%, about 1.3× its average daily range (ATR)
- Volume at 2.2× the 20-day average
- MACD histogram has just turned positive
- Not covered by JournalArta in the last 14 days
Selected automatically from 16 HKEX (Hong Kong) stocks by a technical-signal score with daily weighted randomisation — not a recommendation.
Summary Data Xiaomi
| Last price | 26.38 HKD |
| Change 1 day / 5 days / 1 month | 5.35% / 10.19% / -0.45% |
| Trend / MA-cross | sideways / none |
| SMA20 / SMA50 | 25.52 / 26.51 |
| RSI (14) / Stochastic %K | 53.7 / 85.9 |
| Bollinger %B / ATR | 69% / 1.10 |
| Support / Resistance 20 days | 23.66 / 27.58 |
| Data as of | 14 October 2026 15:08 WIB |
Disclaimer: This technical analysis is generated automatically from exchange data (via Yahoo Finance) and indicators calculated by JournalArta, for information and education only. The verdict and the entry, target and stop-loss levels are not investment advice or a solicitation to buy or sell any security. Investment decisions and their risks rest solely with the reader.
Track Xiaomi share price daily: live levels, support/resistance and our full Xiaomi analysis history.