DBS Stock Gains 0.66%, Testing Key Resistance In Focus
On Agustus 31, 2026: price 76.15 SGD, trend uptrend, RSI 59.0, support 73.55, resistance 76.99. technical analysis of dbs stock. DBS Stock Gains — full details…
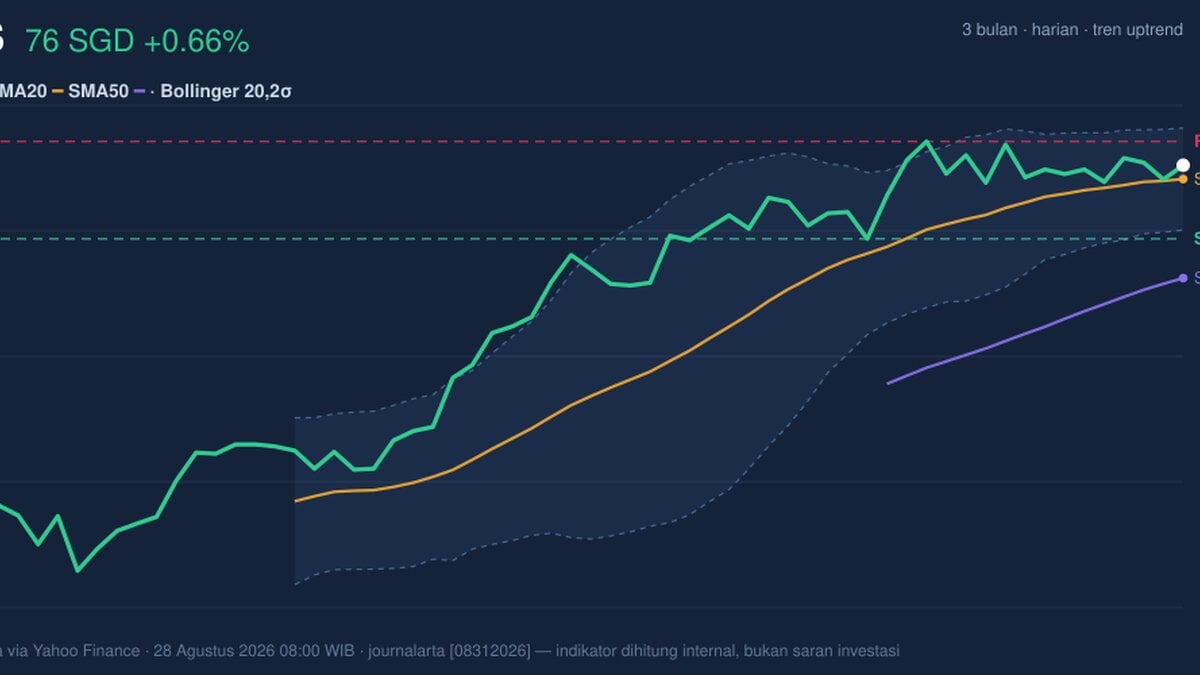
DBS Group’s shares were last at 76.15 SGD, up 0.66% on the day and holding just above the 75.66 SGD 20-day average, a sign that the stock is still trading in an upward structure even as its nearer-term momentum cools. The price is also sitting close to the upper half of its recent range, with the 20-hour support at 73.55 and resistance at 76.99, while the three-month high stands at 77.97. That places DBS in a familiar market position: not in a runaway move, but still pressing against the top end of its band.
Trend & Price Action
The chart shows a stock that remains technically constructive because price is above SMA20 and well above SMA50 at 72.17, which means the medium-term trend is still pointing higher rather than rolling over. The uptrend label is supported by the rising SMA20 slope of 0.53% over 5 days; in plain terms, the short-term trend line is still tilting upward, so dips have so far been met with buying interest. There is no fresh moving-average crossover to spark a new trend signal, but the existing alignment still favours stability over breakdown. What matters now is whether DBS can keep respecting the 20-day average as a floor while it tests the upper edge of its recent range.
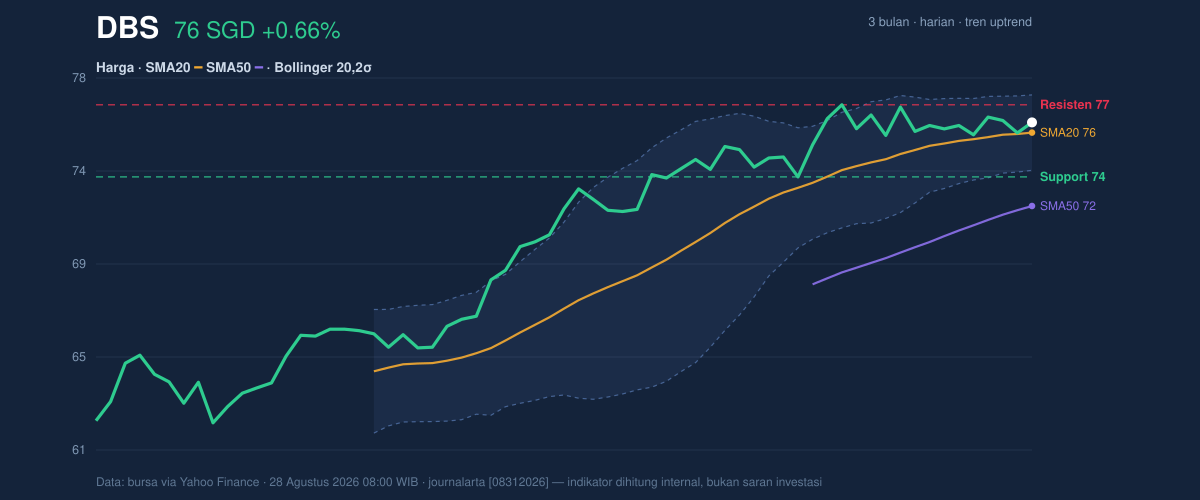
The price is already trading at about 76% of the 20-hour range, which tells you buyers have done most of the heavy lifting for the session. But it also means the stock is approaching an area where rallies often pause.
Oscillators & Momentum
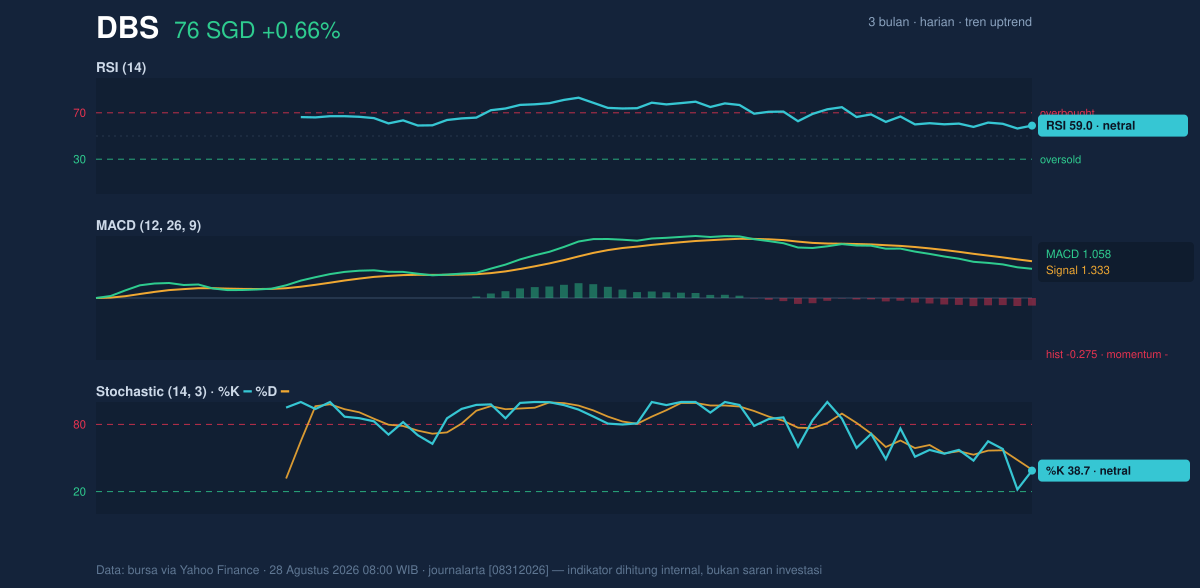
Momentum is less decisive than the trend. The RSI at 59.0 is neutral, which means DBS is not stretched into overbought territory and still has room to move if fresh demand appears. The Stochastic %K at 38.7 and %D at 39.5 are also neutral, suggesting the stock is neither deeply oversold nor showing a strong short-term acceleration signal. That combination usually points to a market that is consolidating inside an uptrend rather than launching into a sharp breakout immediately.
The caution flag comes from the MACD at 1.058 below the signal line at 1.333, with a -0.275 histogram. In simple terms, the trend has not broken, but the pace of the advance has slowed enough for the momentum engine to turn negative. That is often what a mature rally looks like before it either recharges or slips into a deeper pause.
Volatility & Volume
Bollinger Bands help explain why the stock may be coiling rather than trending aggressively right now. The band width is only 4.8%, described as a squeeze, which usually means volatility has contracted and the market is storing energy for a larger move. With price at a %B of 64%, DBS is above the middle band but not hugging the top band at 77.46; that is consistent with a market leaning upward without yet proving a breakout. The lower band sits at 73.86, close enough to the current support zone to matter if sellers regain control.
Volume tells a more restrained story. The latest turnover of 2,515,200 is only 0.6× the 20-day average of 4,438,471, so the move higher has not been backed by broad participation. That matters because rising prices on light volume can be stable, but they are also easier to fade if larger players stay on the sidelines. The one encouraging detail is that OBV is rising, which implies underlying accumulation has not disappeared even though the latest session was quiet.
Key Levels & Scenarios
The immediate technical map is clear. 76.99 is the first resistance to watch, with the 77.46 upper Bollinger band and 77.97 three-month high forming a layered ceiling just above it. On the downside, 75.66 — the 20-day average and Bollinger middle band — is the first line that needs to keep acting as support, followed by 73.86 and the stronger 73.55 support zone. If DBS clears 76.99 with improving participation, the chart would shift from a range-bound advance toward a more convincing test of the recent high area. If it fails to hold 75.66, the squeeze could unwind toward the lower band and support cluster.
The key signal is that DBS is still in an uptrend, but the breakout has not been confirmed because momentum is soft and volume is thin.
Technical Verdict: HOLD (wait & see)
HOLD (wait & see)
- Trend support: Price remains above SMA20 at 75.66 and SMA50 at 72.17, so the broader structure has not deteriorated.
- Momentum caution: MACD is below its signal line, even though RSI 59.0 and Stochastic 38.7/39.5 are neutral.
- Volatility setup: The Bollinger squeeze suggests a larger move may be building, but volume is only 0.6× average, so confirmation is still missing.
- Verdict invalidated if price breaks below 73.55, which would damage the current support structure and expose the lower band area.
- Ideal Entry Range: 75.66 to 73.86
- Exit Target: 76.99 to 77.46
- Stop Loss protection: below 73.55
For non-traders, that means DBS still looks technically healthy, but the next move needs proof before the chart can be called decisive.
“Right now, the market is asking for confirmation, not applause.”
Summary Data DBS
| Last price | 76.15 SGD |
| Change 1 day / 5 days / 1 month | 0.66% / 0.20% / 1.74% |
| Trend / MA-cross | uptrend / none |
| SMA20 / SMA50 | 75.66 / 72.17 |
| RSI (14) / Stochastic %K | 59.0 / 38.7 |
| Bollinger %B / ATR | 64% / 1.19 |
| Support / Resistance 20 days | 73.55 / 76.99 |
| Data as of | 28 Agustus 2026 08:00 WIB |
Track DBS share price daily: live levels, support/resistance and our full DBS analysis history.