Singtel Stock Technicals Today: Gains 0.22%, Death Cross Pressure
On Agustus 31, 2026: price 4.52 SGD, trend sideways, RSI 59.2, support 4.25, resistance 4.52. technical analysis of singtel stock. Singtel Stock Technicals —…
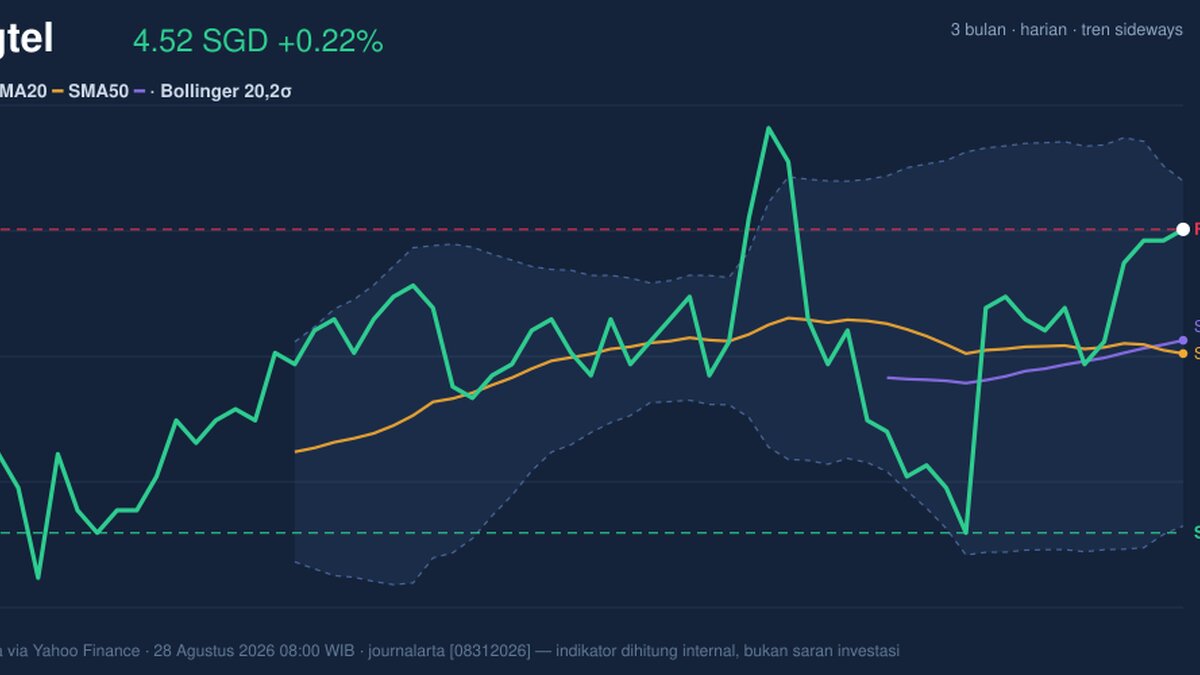
Singapore Telecom (Singtel) edged up to SGD 4.52 on SGX, a small gain that matters more for where it sits in the chart than for the size of the move itself. The stock is now pressing against 20-hour resistance at SGD 4.52, while the broader tape still looks mixed: short-term momentum is improving, but the longer trend has not fully confirmed that strength.
Trend & Price Action
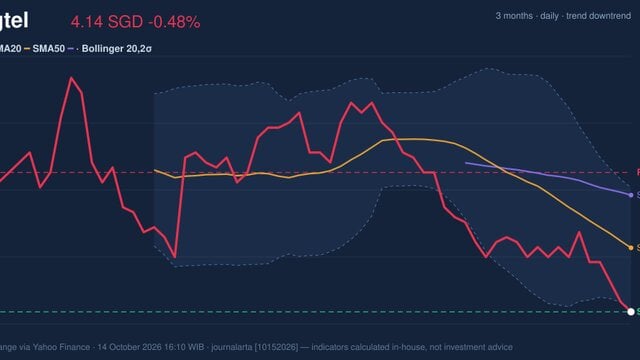
As shown in the chart, Singtel is trading above its SMA20 at SGD 4.41 and above its SMA50 at SGD 4.42, which usually means the price has reclaimed both short- and medium-term averages. But the message is not cleanly bullish. The stock is still described as sideways, and the SMA20 slope of -0.09% over 5 days shows that the nearer-term trend is still drifting lower rather than accelerating upward.
That matters because moving above the averages is only one part of the signal. The other is whether the averages themselves are turning higher. Right now, the chart shows a death cross, with the SMA20 crossing below the SMA50. In plain English, that is a warning that the recent pullback has been strong enough to damage the trend structure, even if the current price is trying to recover. The stock also sits at the top of its 20-hour range, which often invites hesitation unless buyers can force a clean breakout.
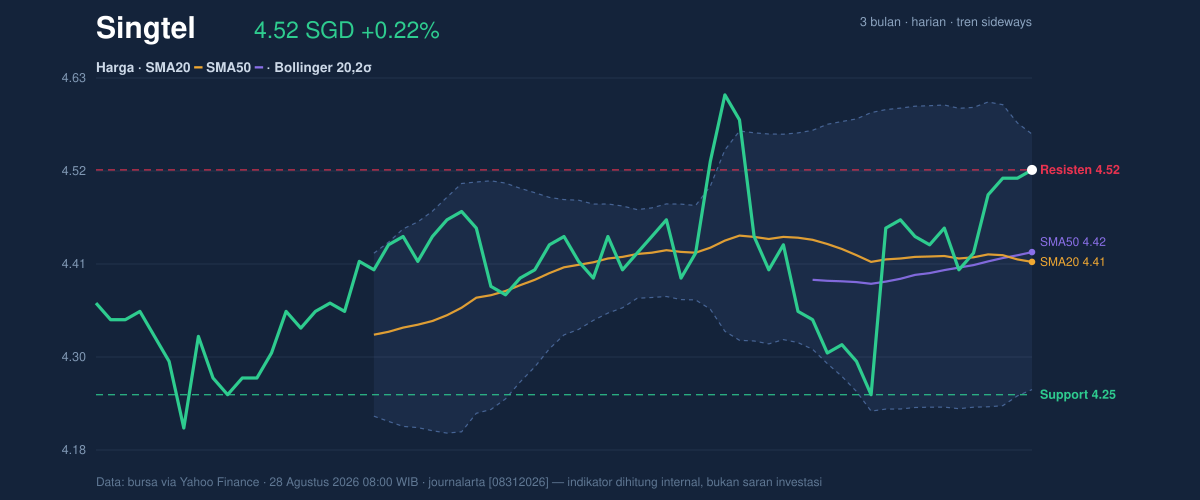
The broader range gives that move more context. Singtel is still below the 3-month high of SGD 4.70 and above the 3-month low of SGD 4.15, so it is trading in the middle-to-upper part of its recent band rather than at an extreme. That positioning suggests the market has repaired some of the earlier weakness, but has not yet proved a new upward leg.
Oscillators & Momentum
The momentum tools are split, and that split is the core story. The RSI at 59.2 is neutral, which means the stock is not technically overextended on that measure. Yet the Stochastic %K at 94.3 and %D at 92.4 are both in overbought territory, telling a different story: the latest push has been fast enough that short-term traders may already be crowded into the move.
That combination often signals a stock that can still rise, but may need a pause first. It is not a classic breakdown setup, because momentum is not weak. It is a late-stage rebound setup, where the market has regained traction but is vulnerable to a near-term stall if buyers do not keep pressing. The MACD at 0.024, above the signal line at 0.009 with a positive histogram of 0.015, supports that view: the underlying momentum is still positive, and the trend-following indicator is not yet rolling over.
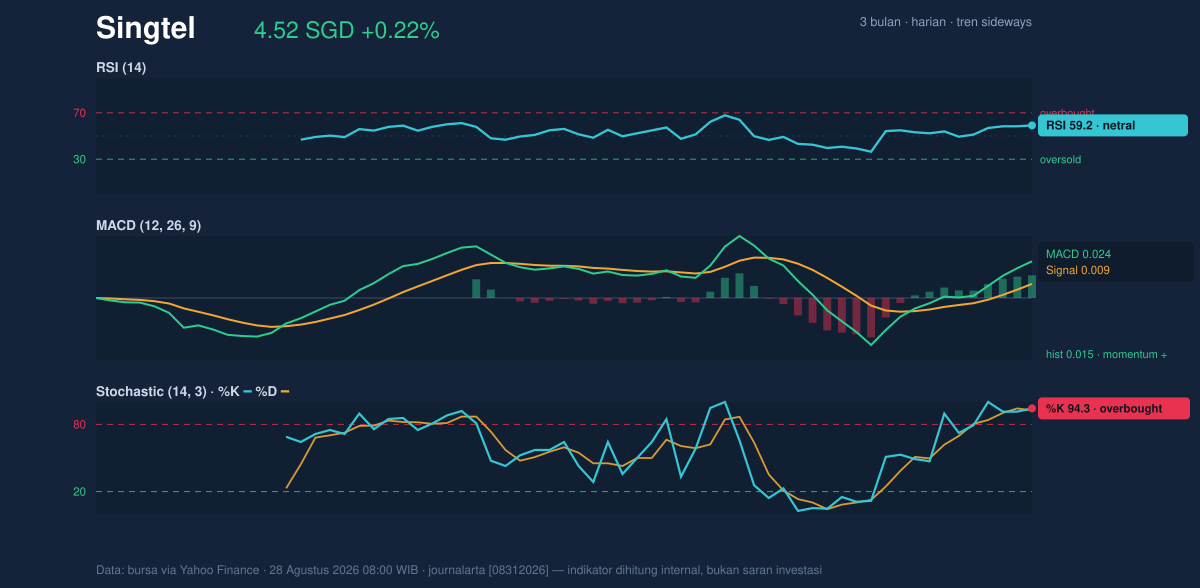
This is why the chart does not read as a simple continuation story. The MACD says the rebound has substance. The Stochastic says the move may be running hot. When those two are both true, the market is usually telling investors that upside can continue, but only if price can absorb profit-taking without losing key support.
Volatility & Volume
Bollinger Bands add another useful layer. The band width is 7.0%, and the squeeze condition implies volatility has compressed. In practical terms, that means the stock has been coiling rather than trending strongly, and compressed bands often precede a sharper move once price leaves the range. With %B at 86%, the price is already sitting close to the upper band at SGD 4.56, which reinforces the idea that near-term upside is being tested right now.
The volatility picture is not extreme. ATR(14) at 0.08, equal to 1.7% of price, points to moderate daily movement rather than a highly unstable chart. That makes the current setup more about direction than drama: if Singtel breaks out, it may do so gradually unless volume expands.
Volume is the missing confirmation. Last session turnover was 20,834,900, below the 20-hour average of 26,817,354, or 0.8× normal. That means the latest advance has not yet been backed by full participation. The OBV is rising, though, and that matters because On-Balance Volume tracks whether money is quietly accumulating even when headline volume is not impressive. In other words, the stock is attracting some buying pressure, but not enough to call the move fully validated.
Key Levels & Scenarios
The market is now sitting on the immediate test point. SGD 4.52 is both the last price and the current 20-hour resistance, so a clean hold above that level would be the first sign that the rebound is trying to turn into a breakout. Above that, the next visible ceiling is the Bollinger upper band at SGD 4.56, followed by the 3-month high at SGD 4.70.
On the downside, the nearest support is the Bollinger middle band and SMA20 zone at SGD 4.41, closely matched by the SMA50 at SGD 4.42. That cluster is important because it is where trend support and mean-reversion support meet. If price slips back below that area, the chart would lose the benefit of the recent recovery and the death-cross warning would become more relevant again. The deeper support remains the 20-hour support at SGD 4.25, with the 3-month low at SGD 4.15 marking the lower edge of the recent range.
Technical Verdict: HOLD (wait & see)
HOLD (wait & see)
- The MACD is positive, which supports the rebound, but the Stochastic is overbought, showing the move may be stretched.
- The price is above the SMA20 and SMA50, yet the chart still carries a death cross and a slightly falling SMA20 slope.
- Volume is below average, so the latest strength has not been confirmed by broad participation.
Verdict invalidated if price falls below SGD 4.41.
- Ideal Entry Range: SGD 4.41 to SGD 4.42
- Exit Target: SGD 4.56, with the next reference at SGD 4.70
- Stop Loss protection: below SGD 4.25
For non-traders, this means Singtel looks steadier than before, but the chart still needs proof before the recent bounce can be treated as durable.
Summary Data Singtel
| Last price | 4.52 SGD |
| Change 1 day / 5 days / 1 month | 0.22% / 2.73% / -1.31% |
| Trend / MA-cross | sideways / death |
| SMA20 / SMA50 | 4.41 / 4.42 |
| RSI (14) / Stochastic %K | 59.2 / 94.3 |
| Bollinger %B / ATR | 86% / 0.08 |
| Support / Resistance 20 days | 4.25 / 4.52 |
| Data as of | 28 Agustus 2026 08:00 WIB |
Track Singtel share price daily: live levels, support/resistance and our full Singtel analysis history.