Testing Support Level, HSBC Stock Drops 0.25% Today
On Agustus 31, 2026: price 161.40 HKD, trend sideways, RSI 51.3, support 160.10, resistance 168.20. technical analysis of hsbc stock. Testing Support Level —…
HSBC Holdings ended at HK$161.40, down 0.25% from the previous close of HK$161.80, with the share now sitting below its 20-day moving average at HK$162.35 even as it remains above the 50-day average at HK$157.81. That positioning matters: it suggests the stock is not in a clean uptrend, but neither is it in a full breakdown. As shown in the chart, HSBC is trading in a sideways structure, with the short-term slope of the 20-day average still slightly negative at -0.39% over five days, a sign that recent price action has been drifting rather than building upward conviction.
Trend & Price Action
The broader technical picture is mixed, and that is the key signal. Price is below the SMA20 but above the SMA50, which usually means the market is stuck between short-term weakness and medium-term support. In plain terms, traders have not yet agreed on direction. The lack of a new moving-average crossover also matters: it tells us the chart has not produced a fresh trend signal, so the stock is still in a waiting pattern rather than a decisive phase.
The share has also softened over multiple time frames, losing 0.92% over five days and 4.04% over one month. That shows the recent pullback is not just a one-day move; it reflects a broader cooling in demand. Yet the stock is still only about 16% of the way through its 20-day support-resistance range, with HK$160.10 as near support and HK$168.20 as near resistance. That placement suggests the market is leaning toward the lower half of its short-term band, but not close enough to support to imply panic.
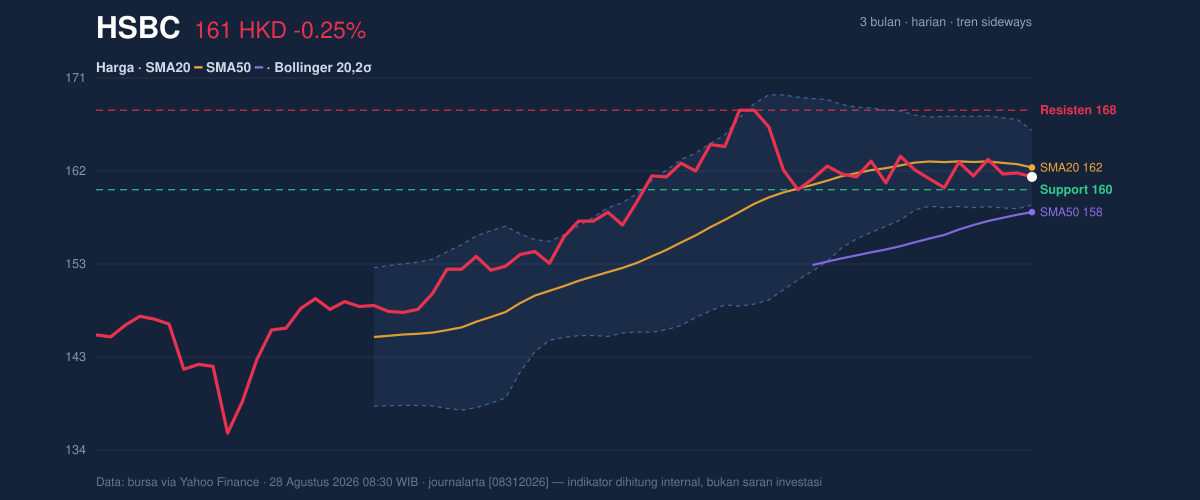
The Bollinger Bands reinforce that message. Price is sitting near the lower-middle area of the band structure, with %B at 37%, meaning the stock is below the midpoint of its recent volatility envelope but not near the extreme lower edge. The band width has narrowed to 4.7%, a classic squeeze signal. A squeeze does not predict direction on its own; it means volatility has compressed, and the next move can be sharper once price escapes the range.
Oscillators & Momentum
Momentum is not giving a strong directional edge. The RSI at 51.3 is neutral, which tells us the stock is neither overbought nor oversold. That usually indicates balance, but in this case it also reflects hesitation: buyers have not pushed the indicator high enough to show momentum strength, while sellers have not forced it into oversold territory.
The Stochastic %K at 40.4 and %D at 46.5 also sits in neutral territory, but the configuration is slightly softer because %K is below %D. That is often read as short-term momentum cooling. It does not automatically mean a decline, but it does mean the current rebound effort lacks force.
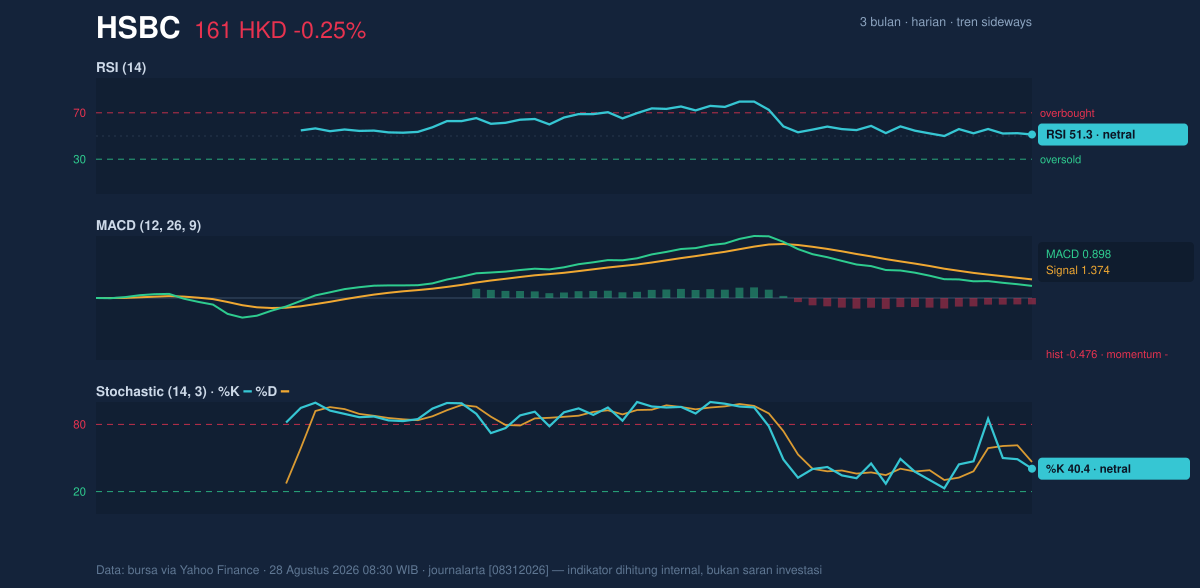
The clearest warning comes from the MACD. At 0.898, it remains below the signal line at 1.374, leaving a -0.476 histogram. This negative histogram is the technical equivalent of momentum lagging behind price: the stock may not be falling hard, but the underlying push is still weaker than the recent average. In a sideways market, that often keeps rallies short unless momentum improves quickly.
Volatility & Volume
Volume adds another layer of caution. The latest turnover was 7,128,635, or only 0.7× the 20-day average of 10,792,695. Lower-than-normal volume means this move is not being strongly validated by participation. When price drifts lower on softer volume, it often suggests conviction is lacking on both sides rather than one side pressing hard. The OBV is falling, however, which is important: on-balance volume tracks whether volume is accumulating behind price or quietly leaving it. A declining OBV implies distribution pressure is still present even if the daily move looks modest.
Volatility is subdued too. The ATR(14) at 2.16, equal to about 1.3% of price, points to a low-volatility environment. That matters because the current Bollinger squeeze and low ATR together suggest the stock is coiling rather than trending. In practical terms, the next move could be more meaningful than the recent day-to-day drift, but the chart has not yet chosen a direction.
Key Levels & Scenarios
The nearest technical floor is HK$160.10. If that level holds, the stock can continue to trade inside the current band and potentially test the upper side again. If it fails, the market may start treating the SMA50 at HK$157.81 as the next reference point, because that is the nearest medium-term support visible in the data.
On the upside, HK$168.20 is the first resistance that matters. A move through that level would show the squeeze is resolving with strength rather than fading back into the range. The broader 3-month high at HK$169.70 sits just above that zone, so the chart has a clear ceiling nearby. The 3-month low at HK$133.50 is far below current trading, which confirms the stock is not in a deep downtrend, but the recent weakness still keeps short-term pressure in focus.
Technical Verdict: HOLD (wait & see)
The technical setup supports a HOLD (wait & see) reading because the chart is balanced but not yet persuasive in either direction.
- Price below SMA20 shows short-term weakness, while price above SMA50 prevents a bearish breakdown call.
- RSI 51.3 and Stochastic 40.4/46.5 are neutral, so momentum is not confirming a strong move.
- MACD histogram -0.476, along with OBV falling and volume at 0.7× normal, says participation is not yet strong enough to validate an upside push.
Verdict invalidated if price falls below HK$160.10 and fails to stabilise there.
- Ideal Entry Range: HK$160.10 to HK$162.35
- Exit Target: HK$168.20
- Stop Loss protection: below HK$157.81
For non-traders, this means HSBC is trapped in a narrow technical range, and the chart is waiting for a stronger move before it gives a clearer direction.
The latest 3-month high and low remain HK$169.70 and HK$133.50.
Summary Data HSBC
| Last price | 161.40 HKD |
| Change 1 day / 5 days / 1 month | -0.25% / -0.92% / -4.04% |
| Trend / MA-cross | sideways / none |
| SMA20 / SMA50 | 162.35 / 157.81 |
| RSI (14) / Stochastic %K | 51.3 / 40.4 |
| Bollinger %B / ATR | 37% / 2.16 |
| Support / Resistance 20 days | 160.10 / 168.20 |
| Data as of | 28 Agustus 2026 08:30 WIB |
Track HSBC share price daily: live levels, support/resistance and our full HSBC analysis history.