CRM Stock Technicals Today: Drops 1.97%, RSI Overbought
On September 7, 2026: price 259.23 USD, trend uptrend, RSI 76.4, support 190.97, resistance 264.43. technical analysis of crm stock. CRM Stock Technicals —…
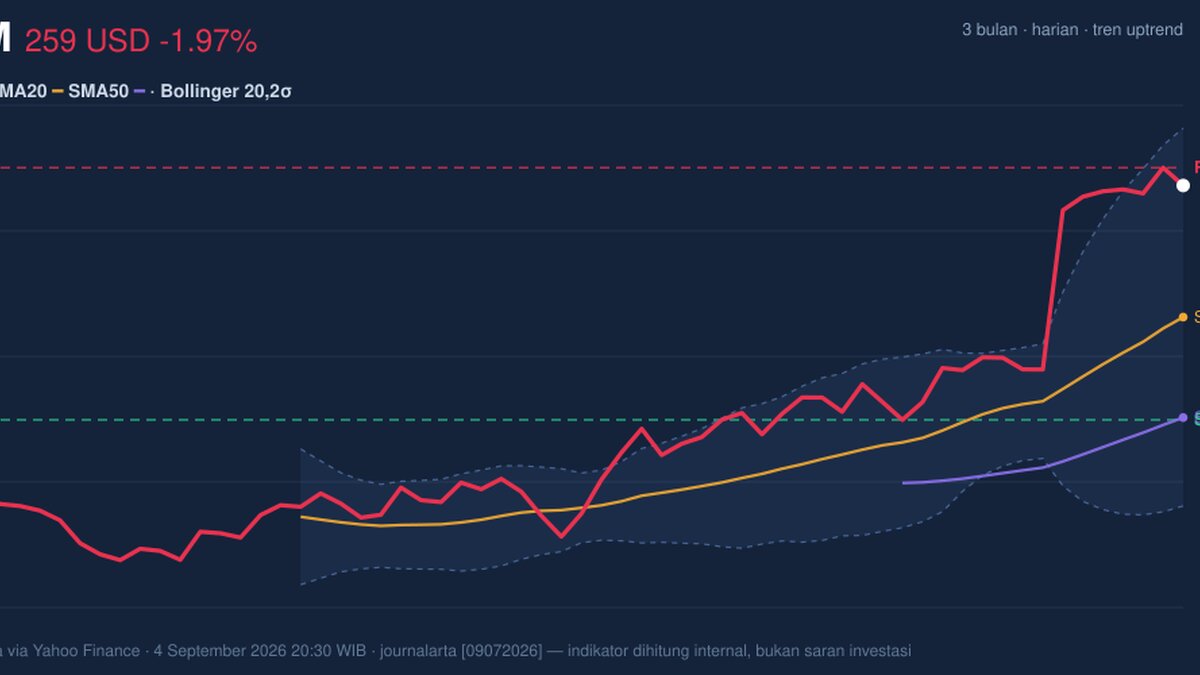
Salesforce (CRM) on the NYSE fell to 259.23 USD on 4 September 2026, after a 1.97% daily decline, even as the shares remained well above their shorter- and medium-term trend lines. The message from the chart is straightforward: the stock is still in a powerful advance, but it is now trading in a zone where momentum is strong enough to stay elevated and stretched enough to invite caution.
Trend & Price Action
The price sits above SMA20 at 220.92 and above SMA50 at 191.65, which keeps the broader structure pointed upward. The SMA20 slope of 8.52% over 5 days shows the short-term trend is still rising quickly, a sign that recent demand has been strong rather than merely stable. As shown in the chart, the stock is trading near the upper end of its recent range, with the last price at 93% of the 20-hour range and just below the 20-hour resistance at 264.43.
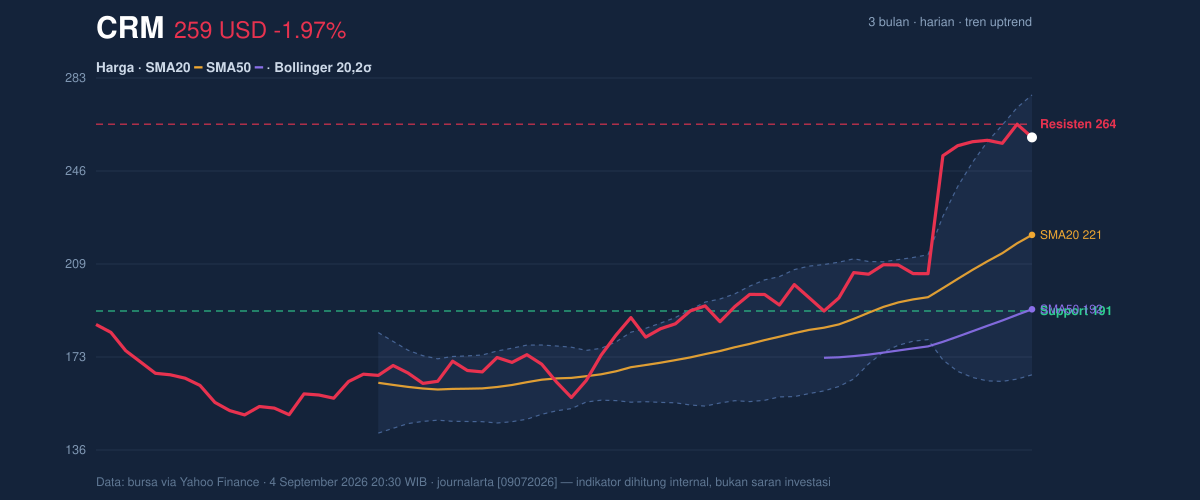
That positioning matters. When a stock holds above both moving averages and stays near resistance, it usually means buyers have been willing to pay up for the name, but the next leg higher may need fresh confirmation rather than just momentum carryover. The 3-month high at 268.27 is close enough to act as a natural ceiling, while the 3-month low at 146.32 shows how far the current move has already travelled.
Oscillators & Momentum
The momentum picture is strong, but also overheated. RSI at 76.4 and Stochastic %K at 88.0 / %D at 90.9 both sit in overbought territory, which means the rally has been fast enough that the stock may be vulnerable to pauses or pullbacks even if the longer trend remains intact. Overbought does not automatically mean reversal; in strong trends, it often means price is running hot and can stay that way for a while.
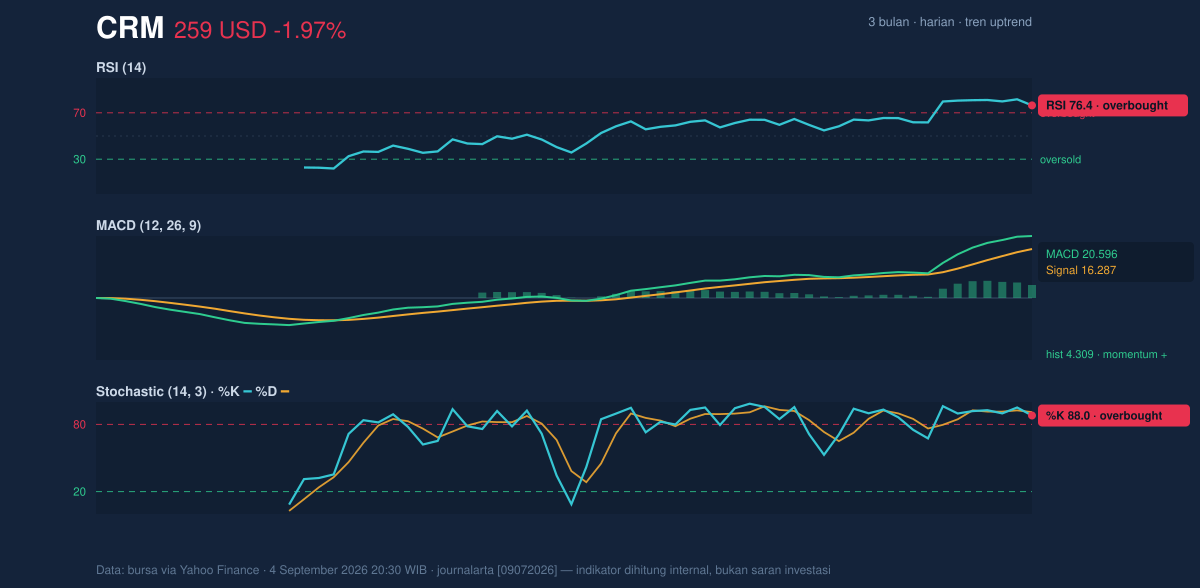
At the same time, the MACD at 20.596 remains above the signal line at 16.287, with a positive histogram of 4.309. That tells readers the uptrend still has confirmation from trend-following momentum rather than showing a clean loss of force. In plain English: the oscillators warn that the move is extended, but MACD says the trend has not yet broken.
Volatility & Volume
Volatility is elevated. The Bollinger Band width of 49.8% indicates the bands are expanding, which usually happens when a stock is moving decisively and can continue to swing widely. The price is also at %B of 85%, meaning it is trading close to the upper band at 275.96. That placement reinforces the idea that the market is paying a premium for momentum, but it also leaves less room for error if enthusiasm cools.
The ATR(14) of 11.46, equal to 4.4% of price, confirms that daily movement is not subdued. ATR is a simple measure of typical trading range, so a reading this high suggests wide intraday swings are likely to continue. Volume adds a more nuanced signal: the latest 10,490,600 shares traded below the 20-day average of 16,432,265, or about 0.6x normal. That means the latest dip did not arrive with unusually heavy selling pressure. The OBV is rising, which implies the broader balance of volume still favors accumulation even though the most recent session was lighter than average.
Key Levels & Scenarios
As shown in the chart, the nearest reference points are well defined. Support at 190.97 marks the lower boundary of the 20-hour range and also sits above the rising medium-term average structure. Resistance at 264.43 is the immediate hurdle, with the 3-month high at 268.27 just above it. The Bollinger upper band at 275.96 is the next technical marker if price clears the current ceiling.
If CRM pushes through 264.43 and then holds above 268.27, the chart would show continuation of the existing trend with room to probe the upper band. If it fails to hold current levels, the first meaningful test is the rising trend structure around 220.92, with deeper weakness exposing 190.97. Because RSI and Stochastic are already overbought, any breakout attempt may need stronger participation than the latest session delivered.
Technical Verdict: HOLD (wait & see)
HOLD (wait & see) fits the chart best because the trend is still constructive, but momentum is stretched and the stock is pressing into resistance.
- Reason 1: Price remains above SMA20 at 220.92 and SMA50 at 191.65, confirming the uptrend.
- Reason 2: RSI 76.4 and Stochastic 88.0 / 90.9 are overbought, which raises the odds of near-term consolidation.
- Reason 3: MACD 20.596 is still above its 16.287 signal line, so trend momentum has not fully faded.
Verdict invalidated if price breaks below 220.92, because that would mean the stock has lost the rising short-term trend line that is currently supporting the advance.
Ideal Entry Range: 220.92 to 240.00
Exit Target: 264.43 to 268.27
Stop Loss protection: 190.97
In plain English, the stock is still strong, but it is running hot and needs to prove it can keep climbing from here.
Latest hard fact: the 20-hour average volume is 16,432,265 shares.
Summary Data CRM
| Last price | 259.23 USD |
| Change 1 day / 5 days / 1 month | -1.97% / 1.26% / 34.50% |
| Trend / MA-cross | uptrend / none |
| SMA20 / SMA50 | 220.92 / 191.65 |
| RSI (14) / Stochastic %K | 76.4 / 88.0 |
| Bollinger %B / ATR | 85% / 11.46 |
| Support / Resistance 20 days | 190.97 / 264.43 |
| Data as of | 4 September 2026 20:30 WIB |
Track CRM stock price daily: live levels, support/resistance and our full CRM analysis history.