HD Stock Analysis: Gains 0.94%, Death Cross Pressure
On September 7, 2026: price 321.05 USD, trend downtrend, RSI 38.2, support 318.07, resistance 354.48. technical analysis of hd stock. HD Stock Analysis — full…
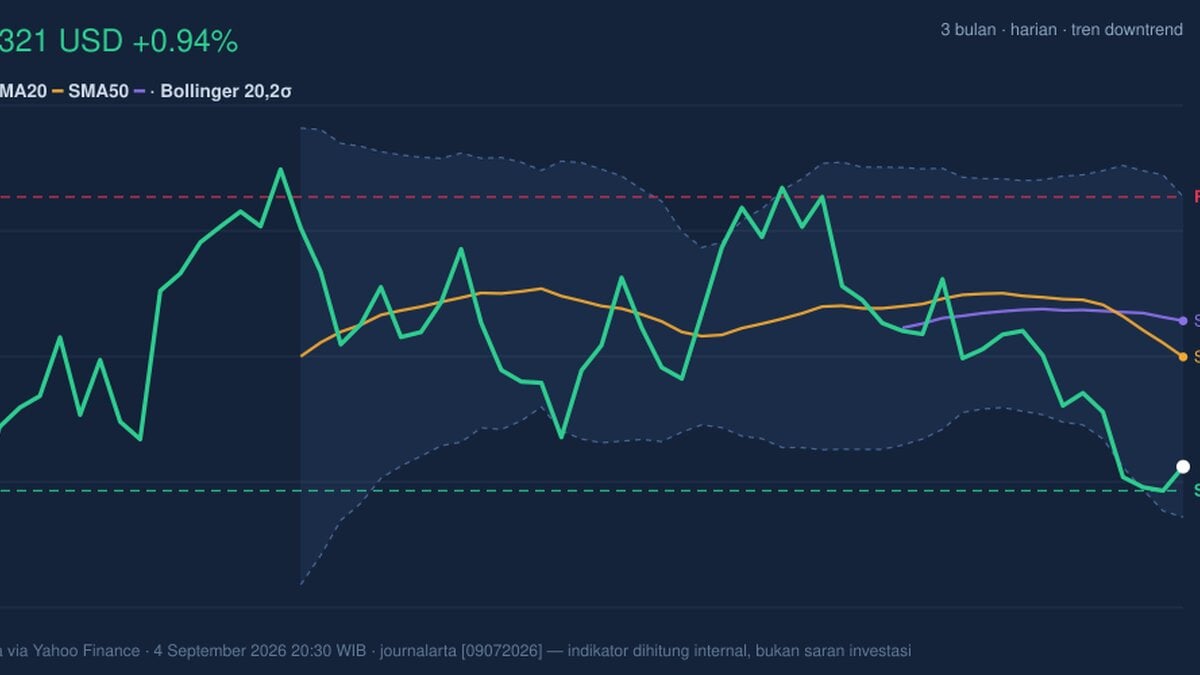
Home Depot shares rose to $321.05 on the NYSE, up 0.94% from the previous close of $318.07, but the move sits inside a larger corrective pattern that has been building for weeks. The stock is now trading below its 20-day and 50-day simple moving averages, and that matters because those lines often act like the market’s short-term and medium-term consensus on value. When price stays under both, it usually signals that rallies are being sold into rather than broadly embraced. The chart also shows a death cross, where the 20-day average has moved below the 50-day average — a classic sign that recent weakness is overpowering the prior trend.
Trend & Price Action
As shown in the chart, Home Depot is still in a downtrend, with the SMA20 sloping down 2.07% over 5 days. That slope is important: it suggests the short-term trend is not merely flat, but still pointing lower. The share price is also sitting near the lower part of its recent trading band, with the last price at $321.05 versus 20-hour support at $318.07 and 20-hour resistance at $354.48. In plain terms, the market is testing the floor while remaining far from the ceiling. The stock’s position near the lower end of the 3-month range — between $358.85 and $307.07 — reinforces that this is a recovery attempt inside a broader pullback, not a confirmed trend reversal.
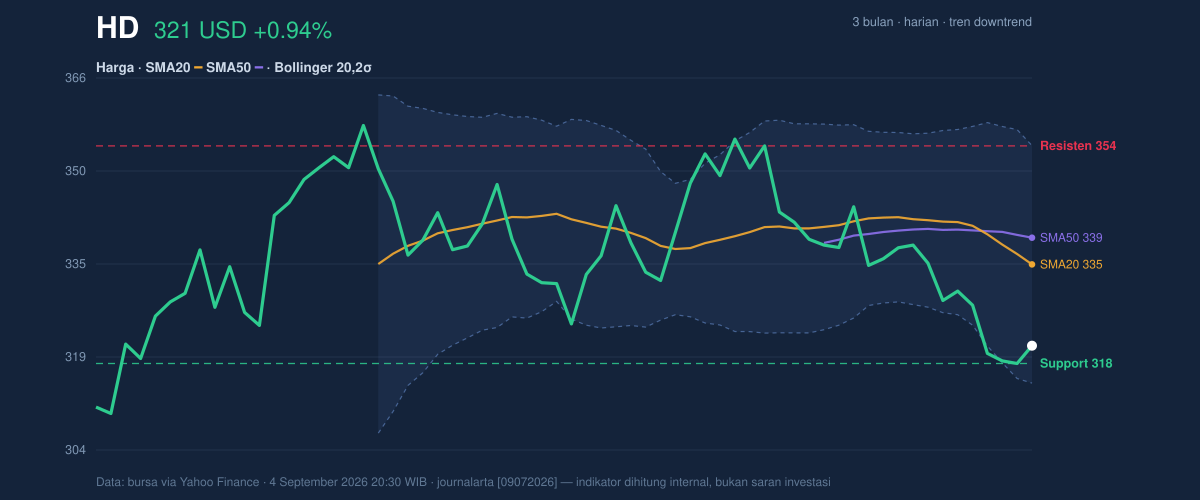
A dense read of the tape says the recent bounce is still fragile. Price is only about 8% into the support-to-resistance range, which means buyers have not yet reclaimed much territory. That is why the current move higher should be treated as a test, not proof.
Oscillators & Momentum
The momentum indicators are mixed, and that mix is telling. The RSI at 38.2 is technically neutral but leaning weak, which means the stock is not deeply washed out, yet it remains below the level that usually suggests healthy upside momentum. By contrast, the Stochastic oscillator is oversold, with %K at 16.6 and %D at 9.1. Oversold readings do not guarantee a rebound; they simply show the stock has fallen far enough, fast enough, that short-term traders may start watching for a bounce. The catch is that oversold conditions can persist in a downtrend.
The MACD is negative, with the line at -5.286, below the signal line at -3.088, and the histogram at -2.198. That configuration means downside momentum is still dominant and recent price action remains weaker than the longer baseline. In other words, the oscillator panel is not yet confirming a durable turn, even though the Stochastic hints the stock is stretched.
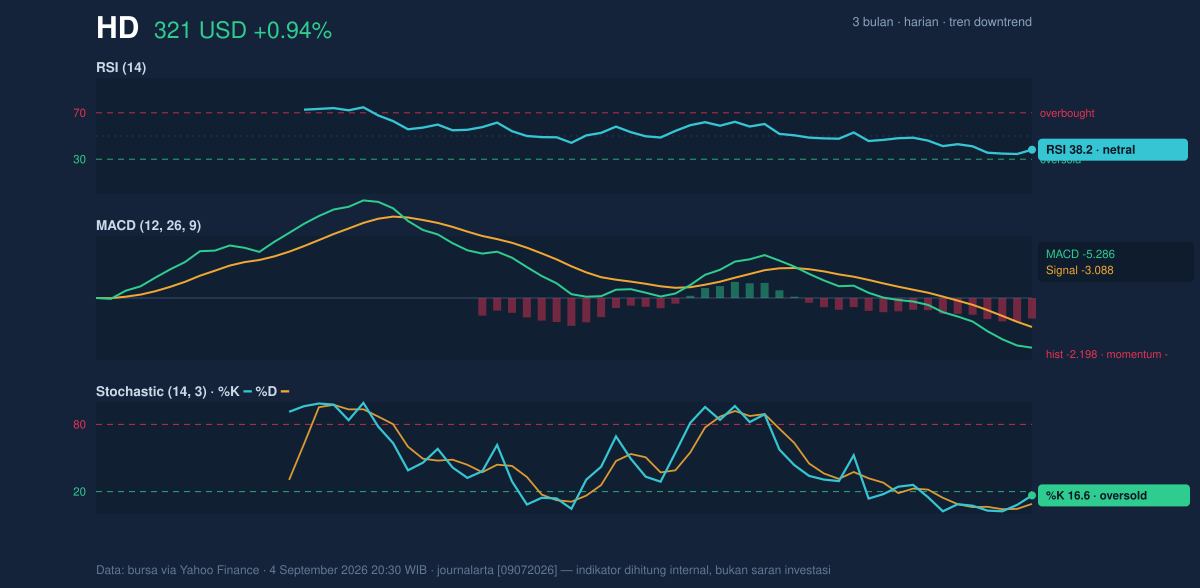
That combination — oversold Stochastic, neutral-to-weak RSI, and negative MACD — usually describes a stock that is technically capable of bouncing, but not yet technically healed.
Volatility & Volume
Volatility is not elevated enough to suggest panic, but it is enough to keep the stock moving. The ATR(14) is $7.34, or 2.3% of price, which points to moderate daily swings. The Bollinger Bands add another layer: price is near the lower band at $314.79, with the middle band at $334.66 and the upper band at $354.53. The %B reading of 16% shows the stock is trading close to the lower edge of its recent volatility envelope. That often reflects either a stretched selloff or a market that has not yet found enough demand to move back toward the middle band.
Volume is not helping the rebound case. The latest volume of 2,261,000 is well below the 20-day average of 3,644,240, or about 0.6× normal. Lower volume on a bounce can mean the move lacks conviction. The falling OBV — on-balance volume, a measure of whether volume is accumulating or leaving the stock — confirms that participation has been heavier on down days than on up days.
Key Levels & Scenarios
The nearest line in the sand is $318.07, the 20-hour support and also the previous close. If that level fails, the chart opens the door to a retest of the lower Bollinger band at $314.79, and then the 3-month low at $307.07. On the upside, the first meaningful barrier is $334.66, the Bollinger midline and SMA20, because reclaiming that area would signal that the stock is no longer trading beneath its short-term consensus. Above that, $339.12 at the SMA50 and then $354.48 to $354.53 form the next resistance cluster. These levels matter because moving back through them would show that buyers are not just defending support, but also rebuilding control of the trend.
As shown in the chart, Home Depot is still trading below the key moving-average cluster, while momentum remains negative and volume is thin. The result is a market that looks oversold enough to bounce, but not strong enough yet to declare the decline over.
Technical Verdict: HOLD (wait & see)
HOLD (wait & see) fits the current setup because the chart is still dominated by a death cross, the MACD remains negative, and OBV is falling, all of which point to lingering downside pressure. At the same time, Stochastic is oversold and price is near support at $318.07, so the stock is stretched enough that a bounce cannot be ruled out. The verdict is invalidated if price falls below $314.79, which would mean the lower Bollinger band and nearby support have failed.
- Ideal entry range: $314.79 to $321.05, where support and lower-band conditions may offer stabilization.
- Exit target: $334.66 first, then $339.12 if the stock reclaims the moving-average zone.
- Stop loss protection: below $307.07, the 3-month low, if downside pressure resumes.
In plain English: the stock is weak, but it is close enough to support that the next move matters more than the last one.
The next scheduled test is whether Home Depot can reclaim $334.66 and then $339.12, while traders watch if $318.07 gives way first.
Summary Data HD
| Last price | 321.05 USD |
| Change 1 day / 5 days / 1 month | 0.94% / -2.77% / -9.72% |
| Trend / MA-cross | downtrend / death |
| SMA20 / SMA50 | 334.66 / 339.12 |
| RSI (14) / Stochastic %K | 38.2 / 16.6 |
| Bollinger %B / ATR | 16% / 7.34 |
| Support / Resistance 20 days | 318.07 / 354.48 |
| Data as of | 4 September 2026 20:30 WIB |
Track HD stock price daily: live levels, support/resistance and our full HD analysis history.