BP Testing Key Resistance: Stock Gains 2.73% (September 11, 2026)
On September 11, 2026: price 565.10 GBp, trend uptrend, RSI 61.9, support 514.50, resistance 557.10. technical analysis of bp stock. BP Testing Key Resistance…
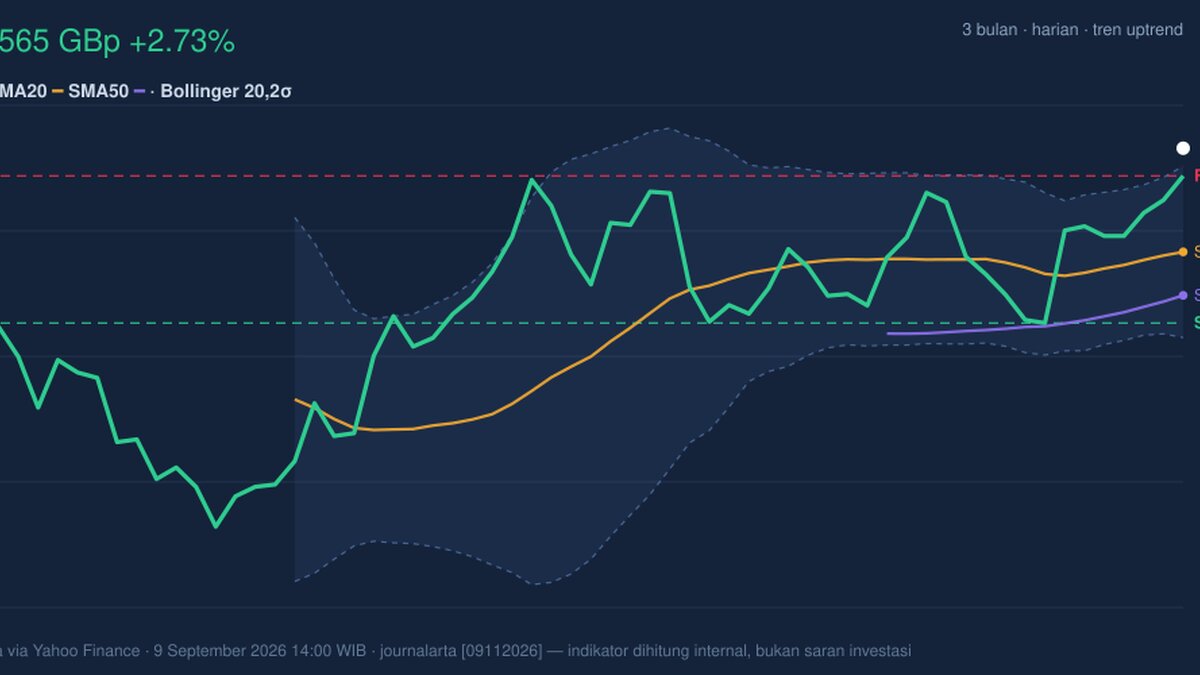
BP plc is trading at a fresh technical premium to its recent range, and the question for international investors is whether that strength is being confirmed by momentum or merely stretching the chart. The shares last changed hands at 565.10 GBp, above both the short- and medium-term trend gauges, but also beyond the upper Bollinger band, a sign that the move is extended rather than comfortably anchored.
Trend & Price Action
The stock is in an uptrend, with the SMA20 at 535.09 sitting above the SMA50 at 522.53. That alignment matters because it shows the recent price trend has improved faster than the broader one; in plain English, buyers have been willing to pay up over the last few weeks, and the medium-term average is now following that lift rather than resisting it.
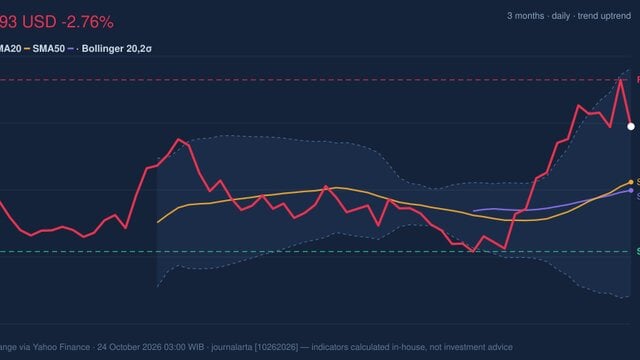
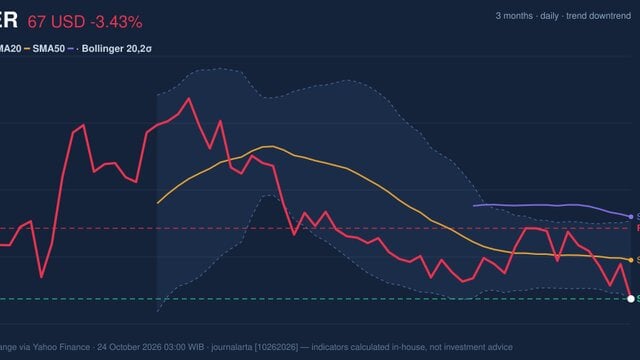
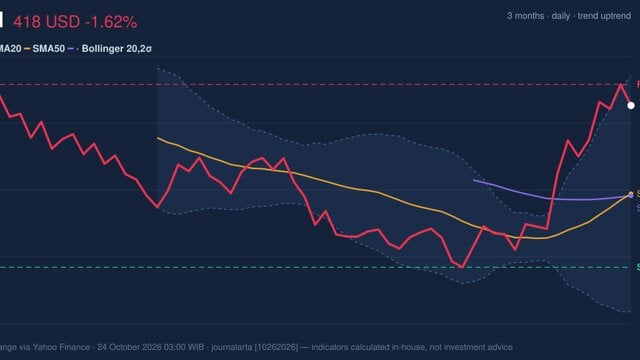
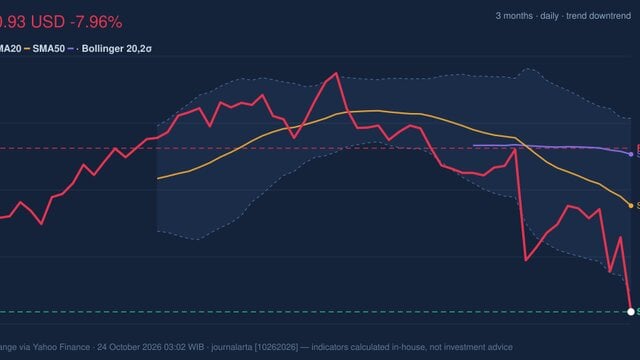
There is no new MA-cross, so this is not a fresh moving-average breakout story. Instead, the chart shows a trend that has already been established and is now being tested for endurance. The slope of the SMA20, at 1.14% over 5 days, reinforces that the shorter trend is still rising, but the latest price action is running hot. As shown in the chart, BP is trading at 119% of the 20-hour range, which means it is pressing near the top of its recent band rather than sitting in the middle where trends often consolidate.

The upper end of the recent structure is clear: the 20-hour resistance at 557.10 has already been exceeded, and the stock is now trading above the 3-month high of 563.20. That is a constructive signal, but it also creates a new test: breakouts only matter if they hold. If the price cannot stay above prior highs, the move can quickly turn into a false breakout.
Oscillators & Momentum
Momentum is supportive, but not cleanly calm. The RSI(14) at 61.9 sits in neutral territory, which means the stock is not yet in a classic overbought warning zone on that measure. However, the Stochastic %K at 87.9 and %D at 82.5 are both in overbought territory, suggesting the recent advance has moved ahead of itself in the short term. In practical terms, this often means the stock can stay strong, but the pace of gains may slow or pause before the next leg.
The MACD at 6.074 is above its signal line at 4.058, with a positive histogram of 2.016. That combination is important because it shows trend momentum is still pointing higher, and the histogram confirms the bullish gap between the MACD line and its signal. As shown in the chart, the momentum picture is therefore mixed but constructive: trend-following indicators are supportive, while the faster oscillators are flashing that the move is getting stretched.

In other words, BP’s chart is not showing a reversal signal yet. It is showing a market that has already advanced enough to attract short-term caution, even as the broader trend remains intact.
Volatility & Volume
Volatility is moderate rather than explosive. The ATR(14) at 16.22, equal to 2.9% of price, suggests the stock is still capable of moving meaningfully in a session, but not in a disorderly way. The Bollinger band width of 9.3% is described as normal, which means this is not a squeeze setup waiting for a sudden expansion. Instead, the key signal is that price is sitting above the upper Bollinger band at 559.88, with %B at 111%. That usually indicates an overextended condition: the market is trading beyond the statistical envelope of recent prices.
That does not automatically mean reversal. It means the stock is priced for strength already, so any further rise needs ongoing confirmation. Volume helps on that front. Last volume was 66,852,369, or 1.4× normal versus the 20-day average of 47,206,491, and OBV is rising. Rising on-balance volume is a useful confirmation because it suggests demand is not just price-driven; more shares are changing hands on the upside, which often supports trend durability.
Key Levels & Scenarios
The chart now places BP in a narrow but meaningful decision zone. The nearest support is the 20-hour support at 514.50, while the first obvious resistance has already been cleared at 557.10. Because the price is now above both the resistance and the 3-month high of 563.20, the market is effectively in breakout territory.
If BP holds above the former resistance band and continues to attract volume, the chart suggests the market is trying to establish a higher trading shelf. If it slips back below the breakout zone, the move would start to look like an exhaustion push rather than a durable trend extension. The SMA20 at 535.09 is a second reference point: staying above it keeps the short-term trend intact, while a drop through it would tell traders that the breakout is losing momentum.
Technical Verdict: HOLD (wait & see)
HOLD (wait & see) fits the current setup because the trend is positive, but the price is also extended above the upper Bollinger band and the Stochastic is overbought. The MACD and rising OBV support the advance, yet the chart is close enough to recent highs that confirmation matters more than chasing strength.
- Strongest reasons:
- MACD bullish with the line above signal and a positive histogram, confirming upward momentum.
- Price above SMA20 and SMA50, showing the trend structure remains constructive.
- Volume at 1.4× normal and OBV rising, indicating participation is backing the move.
- Verdict invalidated if price falls below 535.09, which would place BP back under the SMA20 and weaken the short-term trend.
- Ideal Entry Range: 535.09 to 557.10
- Exit Target: 563.20 and then the next breakout extension above that high if momentum persists
- Stop Loss protection: 514.50
For non-traders, this means BP looks strong, but the chart is already stretched, so the next move matters more than the last one.
Summary Data BP
| Last price | 565.10 GBp |
| Change 1 day / 5 days / 1 month | 2.73% / 4.17% / 5.45% |
| Trend / MA-cross | uptrend / none |
| SMA20 / SMA50 | 535.09 / 522.53 |
| RSI (14) / Stochastic %K | 61.9 / 87.9 |
| Bollinger %B / ATR | 111% / 16.22 |
| Support / Resistance 20 days | 514.50 / 557.10 |
| Data as of | 9 September 2026 14:00 WIB |
Track BP share price daily: live levels, support/resistance and our full BP analysis history.