T Stock Technicals Today: Gains 1.59%, Momentum Weakens
On September 11, 2026: price 25.55 USD, trend uptrend, RSI 56.7, support 24.58, resistance 26.19. technical analysis of t stock. Stock Technicals — full…
By matthew jonathan
September 11, 20265 min read
T Stock Technicals Today
AT&T closed at $25.55, up 1.59% on the day, and the stock is still trading above its short- and medium-term trend lines. That matters because the move is not just a one-day bounce: it places the shares above the 20-day simple moving average at $25.47 and well above the 50-day average at $23.75, a configuration that usually signals the market is willing to pay up for the name while waiting for a clearer catalyst.
Trend & Price Action
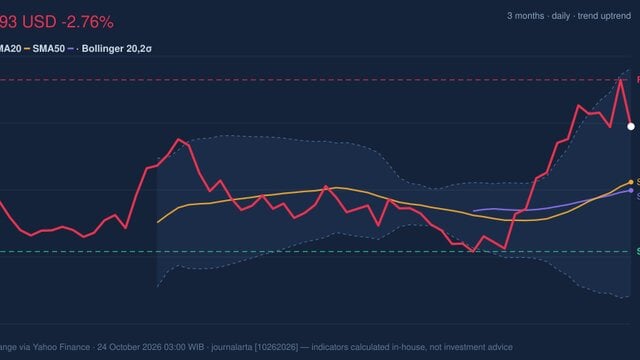
AT&T’s chart, as shown in the price action view, is still leaning upward. The uptrend is supported by the SMA20 slope of 1.57% over 5 days, which means the near-term trend is rising rather than flattening out. Importantly, the stock is not stretched far above its trend base: the last price sits only modestly above the 20-day average, suggesting the move has room to extend without looking immediately overbought.
The absence of a fresh MA-cross is also telling. A new cross between moving averages often marks a shift in market regime; without one, this remains a continuation setup rather than a dramatic trend reversal. The stock is trading in the upper part of its recent range, at about 60% of the 20-day range, which means buyers have the upper hand, but not with the kind of dominance that usually comes with an overextended breakout.
3-month price action chart of T: price, SMA20/50, Bollinger, support & resistance. Data: exchange via Yahoo Finance.
The 3-month range helps frame the bigger picture. AT&T has climbed from a 3-month low of $19.89 toward a 3-month high of $26.44. That is a meaningful recovery, but the stock is now approaching the upper boundary of that range, where supply often becomes more visible. In plain language: investors who bought lower may start taking profits as the share price nears old highs.
Oscillators & Momentum
The momentum picture is more mixed than the trend line suggests. As shown in the momentum chart, RSI at 56.7 is neutral-to-firm, which means the stock is neither overheated nor washed out. That is constructive, because it leaves room for further upside without immediately triggering the kind of momentum fatigue that comes with an RSI above 70.
Momentum chart of T: RSI(14), MACD, Stochastic. Data: exchange via Yahoo Finance.
The Stochastic %K at 45.7 and %D at 38.1 also sit in neutral territory. Stochastic compares the stock’s latest close with its recent trading range; readings in the middle band usually mean the move is still developing, not exhausted. The more cautionary signal comes from MACD at 0.485 versus signal at 0.614, with a histogram of -0.129. That negative histogram means short-term momentum has slipped below the signal line, even while the broader trend remains positive. In other words, the stock is still trending up, but the pace of that advance has cooled.
That divergence matters. Price can keep rising while momentum softens, but it often warns that the next push higher may need stronger volume or a fresh catalyst to clear resistance cleanly.
Volatility & Volume
The Bollinger Bands suggest AT&T is in a calm but potentially pivotal phase. The band width of 7.3% is relatively tight and described here as a squeeze, which often precedes a larger move. A squeeze does not predict direction; it only says the market has been compressing and may be preparing to expand. The %B reading of 54% places the stock just above the middle of the band structure, another sign that price is balanced rather than extreme. The upper band at $26.40 now acts as a near-term ceiling, while the lower band at $24.54 offers a lower boundary if sentiment weakens.
Volume was supportive, but only moderately so. The latest turnover of 34,185,700 shares was about 1.1 times normal, enough to confirm participation but not enough to scream conviction. That is where the OBV decline becomes important. On-Balance Volume falling while price holds up can mean the rally is not being backed by broad accumulation. Put simply, some of the recent price strength may be happening without fully committed buying behind it.
“The stock is rising, but the tape is not yet shouting conviction.”
Key Levels & Scenarios
The nearest support is $24.58, with the Bollinger lower band at $24.54 reinforcing that zone. If the share price loses that area, the market would likely be signaling that the recent squeeze is resolving downward rather than upward. On the upside, resistance sits at $26.19, just below the upper Bollinger band at $26.40 and close to the 3-month high of $26.44. That cluster makes the mid-$26 area the first real test for any continuation move.
The setup is therefore straightforward: if AT&T can hold above the mid-$24s, the compressed volatility leaves room for an attempt at the upper-$26 zone. If it cannot, the chart risks slipping back toward the 20-day average, which is where trend credibility would start to be questioned.
Technical Verdict: HOLD (wait & see)
HOLD (wait & see)
- Why: price is above the SMA20 at $25.47 and well above the SMA50 at $23.75, which keeps the broader trend constructive.
- Why: the Bollinger squeeze and ATR of 0.51 point to a market that is compressed enough to move, but not yet showing a decisive directional breakout.
- Why:MACD is negative versus its signal line, and OBV is falling, so momentum and participation are not fully confirming the price strength.
- Verdict invalidated if price breaks below $24.58, the nearest support and the lower edge of the current structure.
- Ideal Entry Range:$24.58 to $25.47
- Exit Target (Target Price):$26.19 to $26.40
- Stop Loss protection:below $24.54
In plain English: the shares are holding up, but the chart still needs proof that the next move has real force behind it.