AIA Momentum Gains: Stock Drops 0.33% (September 14, 2026)
On September 14, 2026: price 75.05 HKD, trend sideways, RSI 47.5, support 72.55, resistance 77.50. technical analysis of aia stock. AIA Momentum Gains — full…

AIA Group ended at 75.05 HKD, down 0.33% from the previous close of 75.30, and the stock is now sitting just under its short-term average while the broader pattern remains sideways. That matters because it shows a market that is not in a clean trend, but is also not breaking down decisively. The shares are trading below the SMA20 at 75.22 and below the SMA50 at 75.36, which signals mild near-term weakness, yet the absence of a fresh moving-average cross suggests the chart has not flipped into a more forceful downtrend. As shown in the chart, AIA is still positioned roughly in the middle of its recent range, which often means the market is waiting for a catalyst rather than already pricing one in.
Trend & Price Action
The price structure is best described as a narrow balancing act. AIA is down 3.16% over five days, but still up 6.61% over one month, so the recent pullback is more of a pause than a full reversal. The sideways trend label fits the data: the stock is not escaping its range, and the SMA20 slope of 1.23% over five days shows that short-term momentum has flattened rather than accelerated. That kind of setup often precedes a directional move, but the direction is not yet decided.
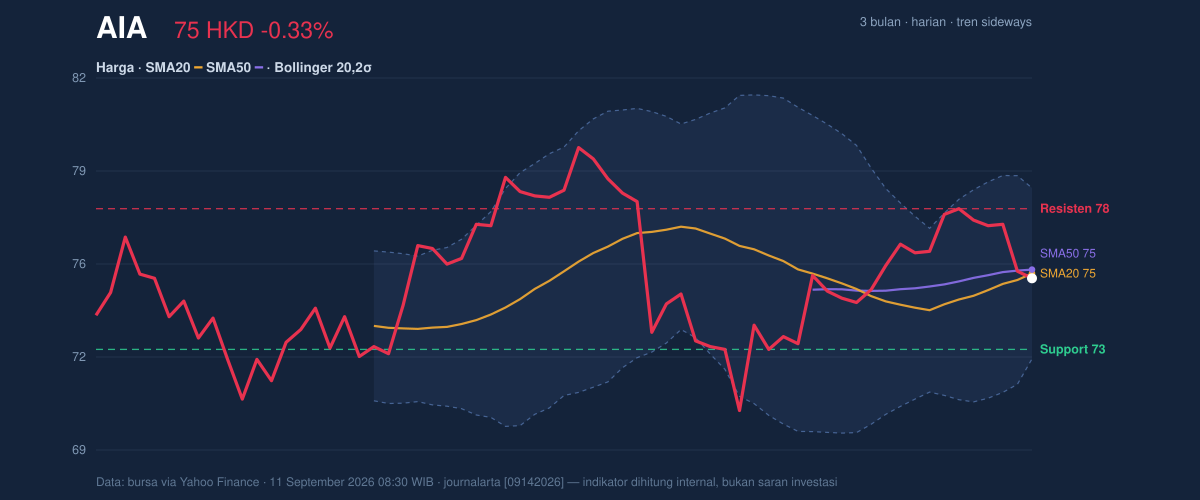
The Bollinger Bands help explain why the market may be coiling. The upper band is at 78.23, the middle band at 75.22, and the lower band at 72.22. With the last price almost exactly on the middle band and %B at 47%, AIA is neither stretched nor washed out; it is sitting close to the center of the band structure. More importantly, the band width is only 8.0% and is described as narrowing, which is a classic squeeze signal. In plain language, that means the stock has been moving quietly, and quiet periods often end with sharper moves once traders commit in one direction.
Oscillators & Momentum
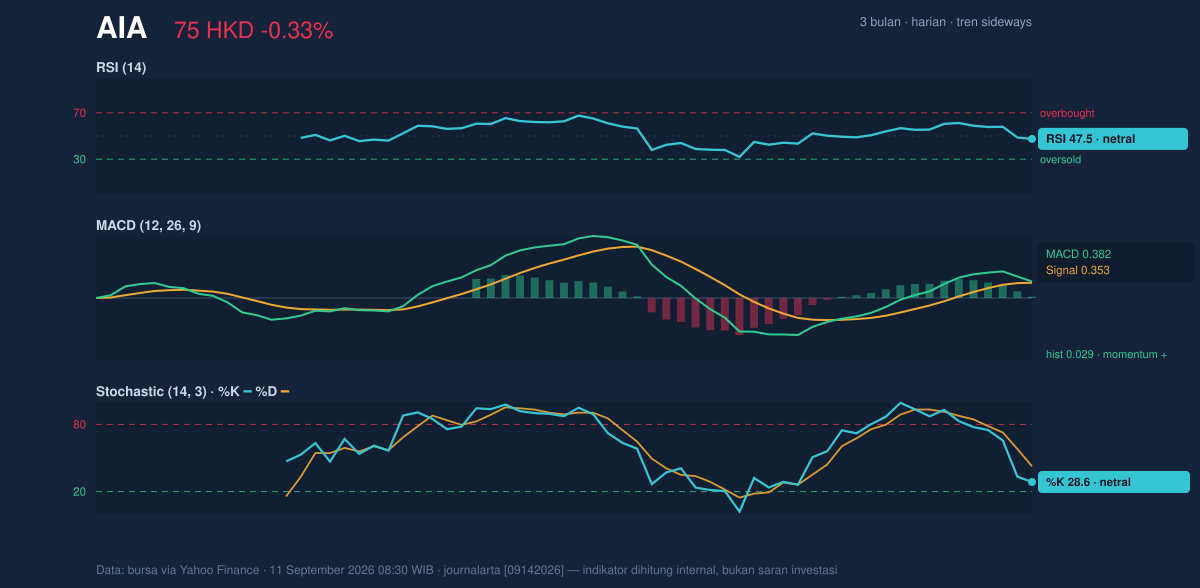
Momentum is mixed, but not broken. The RSI at 47.5 is neutral, which means the stock is not overbought and not oversold. That matters because it leaves room for either direction without an immediate technical ceiling or floor from the oscillator itself. The Stochastic %K at 28.6 and %D at 42.5 are also neutral, but the lower %K reading shows short-term price action has cooled more than the broader oscillator line. That can be read as fading near-term momentum, though not a confirmed reversal.
The most constructive signal comes from MACD. AIA’s MACD is 0.382, above the signal line at 0.353, with a positive histogram of 0.029. In practical terms, that means the underlying trend impulse is still slightly positive even though the share price is hovering below the moving averages. This is an important nuance: price has softened, but momentum has not fully rolled over. When price and momentum point in different directions like this, the market is often in transition rather than in a settled trend.
Volatility & Volume
Volatility is moderate, not extreme. The ATR(14) of 1.56, equal to 2.1% of the share price, suggests that a typical daily move is manageable rather than wild. Combined with the narrow Bollinger width, that points to a market where the next meaningful move could be larger than the recent day-to-day drift. The key question is whether that move comes from accumulation or distribution.
Volume leans slightly constructive. The latest turnover of 23,045,025 was below the 20-day average of 27,211,466, or 0.8x normal. On its own, that says conviction was not especially strong in the latest session. But OBV is rising, and that matters because on-balance volume tracks whether money flow is building beneath the surface. Rising OBV while price is flat or slightly weak often suggests buyers are still present, even if they are not yet forcing a breakout. It is not a guarantee, but it is a better sign than falling OBV would be.
Key Levels & Scenarios
The chart’s most important reference points are clear. Near-term support sits at 72.55, while resistance is 77.50. AIA is currently at about 51% of the range, which reinforces the idea that the stock is mid-channel rather than pressing a boundary. The broader 3-month high is 80.15 and the 3-month low is 69.35, so the stock is trading inside a well-defined envelope rather than making new extremes.
If AIA can move back above the middle band and hold above 75.22, the chart would start to look less hesitant, with 77.50 becoming the first obvious test. If that resistance gives way, the upper Bollinger band at 78.23 and the 3-month high at 80.15 become the next technical markers. If the stock slips below 72.55, the squeeze setup loses its constructive shape and the market would likely be probing the lower band at 72.22 and then the 3-month low at 69.35.
Technical Verdict: HOLD (wait & see)
HOLD (wait & see) fits the current setup because the chart is balanced between soft price action and mildly supportive momentum. The main reasons are: price is below both SMA20 and SMA50, which keeps short-term trend pressure in place; MACD remains positive, which prevents the picture from turning outright bearish; and the Bollinger Bands are squeezing, which often signals a move is coming but not yet which way. The verdict would be invalidated if price falls below 72.55, because that would weaken the range structure and expose the lower band area.
- Ideal entry range: 72.55 to 75.22
- Exit target: 77.50, then 78.23
- Stop loss protection: below 72.22, with 69.35 as the deeper failure point
For non-traders, this means AIA is not giving a clear green or red signal yet, but the chart is tight enough that the next move could matter more than the last few sessions.
AIA closed at 75.05 HKD on 11 September 2026, with support at 72.55 and resistance at 77.50.
Summary Data AIA
| Last price | 75.05 HKD |
| Change 1 day / 5 days / 1 month | -0.33% / -3.16% / 6.61% |
| Trend / MA-cross | sideways / none |
| SMA20 / SMA50 | 75.22 / 75.36 |
| RSI (14) / Stochastic %K | 47.5 / 28.6 |
| Bollinger %B / ATR | 47% / 1.56 |
| Support / Resistance 20 days | 72.55 / 77.50 |
| Data as of | 11 September 2026 08:30 WIB |



