OCBC Stock Analysis: Gains 0.24%, Testing Support Level
On October 28, 2026: price 29.03 SGD, trend downtrend, RSI 36.3, support 28.80, resistance 32.20. technical analysis of ocbc stock. OCBC Stock Analysis — full…
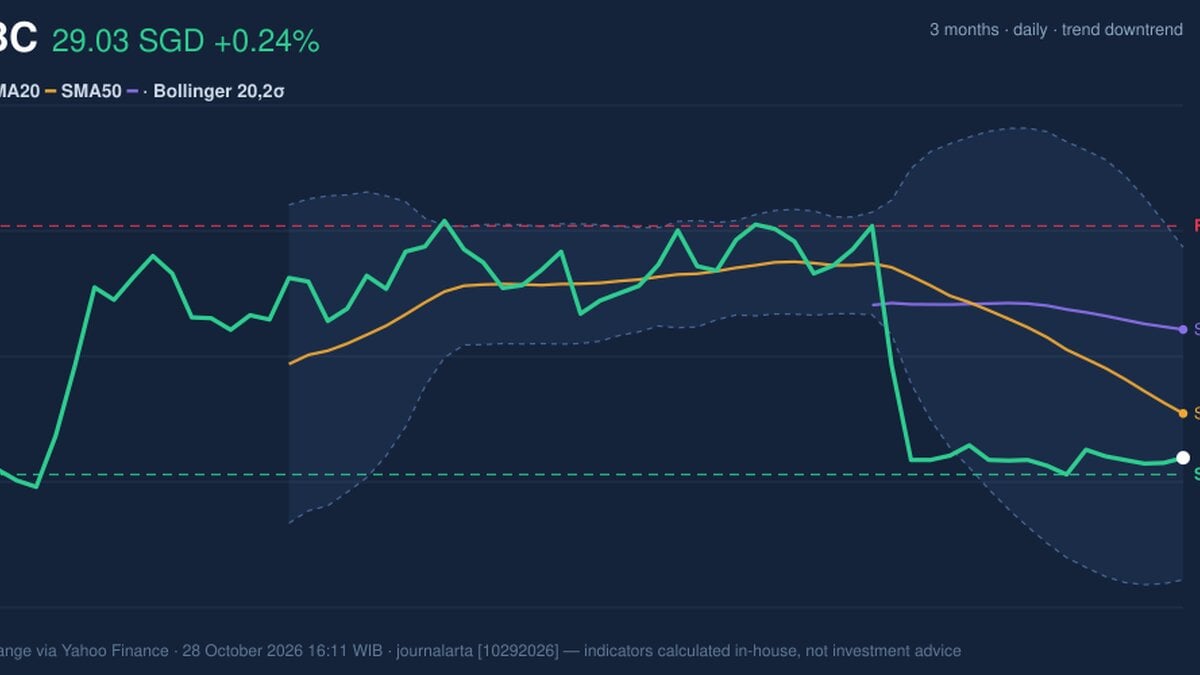
OCBC shares closed at S$29.03 on the Singapore Exchange on Wednesday, October 28, 2026, up 0.24% on the day from a prior close of S$28.96, according to exchange data compiled by Yahoo Finance. The stock sits just above its three-month low of S$28.51, and the MACD histogram, a gauge of whether selling or buying pressure is gaining ground, has only just turned positive. Together those two facts explain why a bank that has lost 9.25% over one month is back on the watchlist.
Why OCBC is in focus today
- Trading near its 3-month low (28.51)
- MACD histogram has just turned positive
Selected automatically from 16 SGX (Singapore) stocks by a technical-signal score with daily weighted randomisation — not a recommendation.
Trend & Price Action
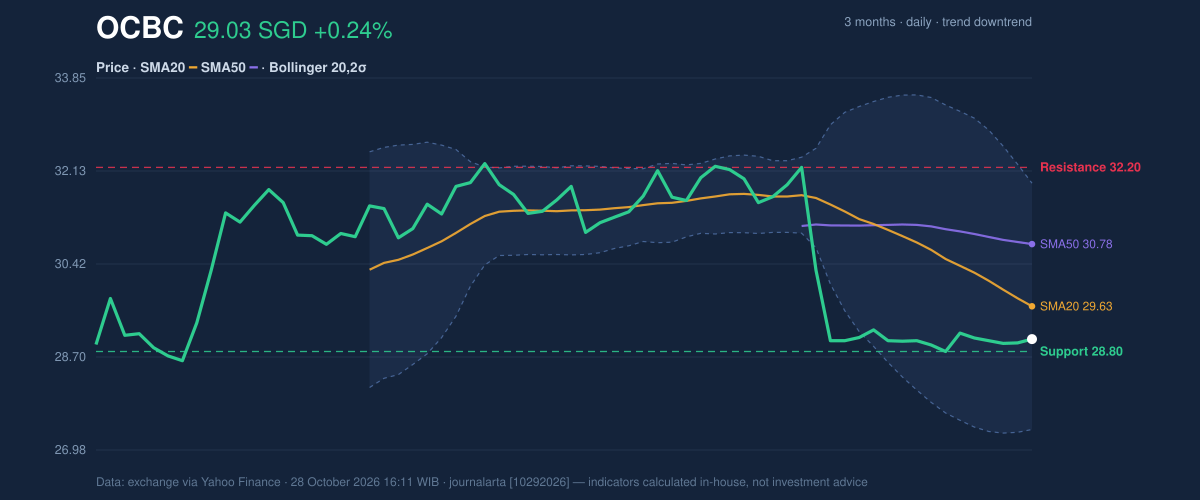
The broader picture is still weak. The shares are down 0.38% over five days and 9.25% over one month, and the price sits below the 20-day average of S$29.63, which in turn is under the 50-day average of S$30.78. That ordering, short average under long average with price beneath both, is the textbook shape of a downtrend. The 20-day average itself fell 2.47% over five days, meaning the slide is still pulling the benchmark lower rather than flattening. The data show no new moving-average crossover, so the trend label rests on the existing alignment, not a fresh signal.
As shown in the chart, the shares are hovering near the bottom of their recent range. The 20-day support is at S$28.80 and resistance at S$32.20, with the price sitting about 7% of the way up that corridor. The three-month high and low are S$32.57 and S$28.51. A stock this close to its floor has little room to fall before testing a level that buyers have defended before; it also has a long way to climb before meeting resistance.
Oscillators & Momentum
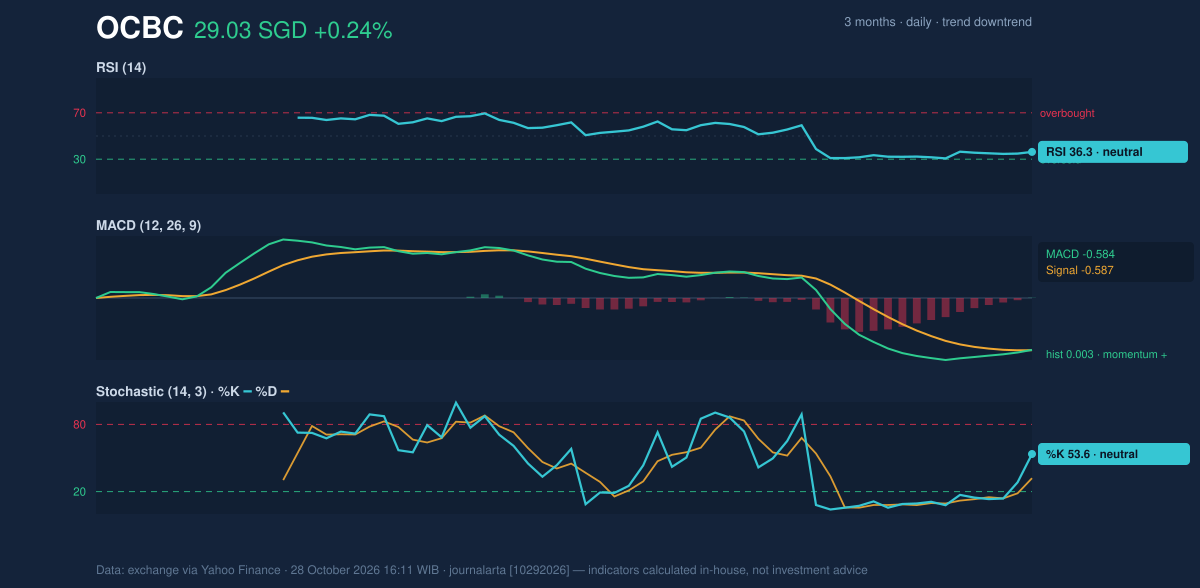
Momentum indicators suggest selling pressure is easing, not reversing. The 14-day Relative Strength Index, which measures the speed of recent gains against losses on a 0-100 scale, stands at 36.3. That is neutral by convention, though closer to the 30 line that usually marks oversold conditions than to 50. The Stochastic oscillator, which shows where the close sits within its recent range, reads %K 53.6 and %D 31.9. The faster line is above the slower one, a mild sign of improvement from depressed levels.
The MACD, which compares short- and long-term price averages, is at -0.584 against a signal line of -0.587, leaving a histogram of +0.003. The number is tiny, and it should be read that way: the gap between the two lines has just closed, so downward momentum has stopped accelerating. It is not evidence of a rebound. Both lines remain well below zero, which keeps the broader reading bearish.
Volatility & Volume
Bollinger Bands, which draw a channel two standard deviations around the 20-day average, run from S$27.36 to S$31.91. Band width of 15.4% is normal, and the price sits at a %B of 37%, meaning it is in the lower half of the channel but not pressed against the floor. The 14-day Average True Range, a measure of typical daily movement, is 0.44, or 1.5% of the price, which points to low volatility. Calm trading near lows can mean sellers are tiring, though it can equally mean a lack of interest.
Volume supports the second reading. Wednesday's turnover of 3,289,540 shares was only 0.4 times the 20-day average of 8,227,632, a thin session. On-balance volume, which tallies volume on up days against down days, is still falling, so the recent decline has not been matched by accumulation. A bounce on volume this light would carry little conviction.
Key Levels & Scenarios
The immediate test is S$28.80. A close below it would put the S$28.51 three-month low in play and, beyond that, the lower Bollinger band at S$27.36. On the upside, a move through the 20-day average at S$29.63 would be the first sign that the short-term downtrend is loosening, with the 50-day average at S$30.78 the next hurdle.
Technical Verdict: HOLD (wait & see)
The verdict is HOLD (wait & see), based on three readings:
- Trend: price is below both the 20-day and 50-day averages, and the 20-day average is still falling.
- Momentum: the MACD histogram has turned marginally positive, but RSI at 36.3 and a MACD below zero stop short of confirming a reversal.
- Participation: volume at 0.4 times average and falling OBV show no buying support yet.
- Entry range: S$28.80 to S$29.63, from support up to the 20-day average, with confirmation preferred on a close above S$29.63.
- Exit target: S$30.78 (50-day average), with S$31.91 (upper Bollinger band) as an extended level.
- Stop loss: below S$28.51, the three-month low.
The verdict is invalidated if the price closes below S$28.51. In plain terms, the share price has stopped falling fast but has not yet shown it can turn higher, so the technical picture calls for patience.
This is technical analysis, not an investment recommendation.
| Indicator | Value |
|---|---|
| Last price (Oct 28, 2026) | S$29.03 |
| Change: 1 day / 5 days / 1 month | 0.24% / -0.38% / -9.25% |
| SMA20 / SMA50 | 29.63 / 30.78 |
| Bollinger (lower / middle / upper) | 27.36 / 29.63 / 31.91 |
| RSI(14) | 36.3 |
| Stochastic %K / %D | 53.6 / 31.9 |
| MACD / signal / histogram | -0.584 / -0.587 / 0.003 |
| ATR(14) | 0.44 |
| Support / resistance (20 days) | 28.80 / 32.20 |
| 3-month low / high | 28.51 / 32.57 |
Summary Data OCBC
| Last price | 29.03 SGD |
| Change 1 day / 5 days / 1 month | 0.24% / -0.38% / -9.25% |
| Trend / MA-cross | downtrend / none |
| SMA20 / SMA50 | 29.63 / 30.78 |
| RSI (14) / Stochastic %K | 36.3 / 53.6 |
| Bollinger %B / ATR | 37% / 0.44 |
| Support / Resistance 20 days | 28.80 / 32.20 |
| Data as of | 28 October 2026 16:11 WIB |
Disclaimer: This technical analysis is generated automatically from exchange data (via Yahoo Finance) and indicators calculated by JournalArta, for information and education only. The verdict and the entry, target and stop-loss levels are not investment advice or a solicitation to buy or sell any security. Investment decisions and their risks rest solely with the reader.
Track OCBC share price daily: live levels, support/resistance and our full OCBC analysis history.