Wilmar Stock Technicals: Gains 0.62% on Wednesday, RSI Oversold
On October 28, 2026: price 3.27 SGD, trend downtrend, RSI 29.8, support 3.25, resistance 3.60. technical analysis of wilmar stock. Wilmar Stock Technicals —…
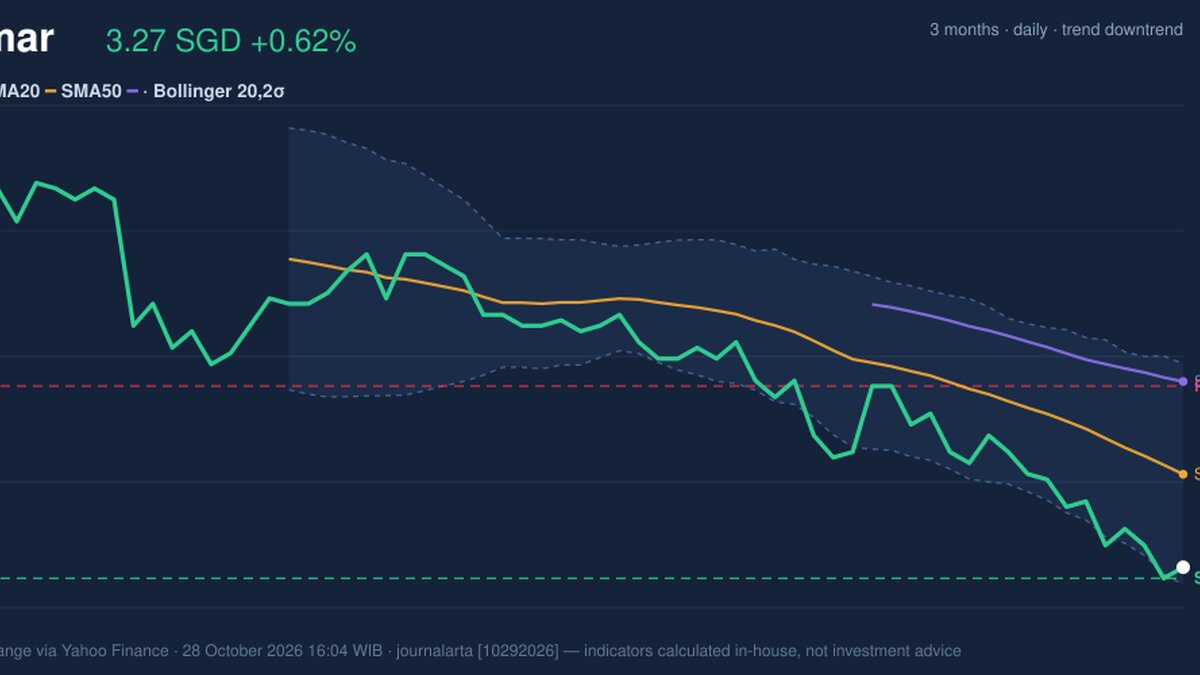
Wilmar International (SGX: F34) closed at S$3.27 on Wednesday, October 28, 2026, up 0.62% from the previous close of S$3.25, but the small bounce comes after a slide that has taken 3.54% off the shares over five days and 9.42% over one month, according to exchange data via Yahoo Finance. The stock was picked for attention because its 14-day Relative Strength Index (RSI), a gauge of how fast prices have fallen or risen, sits at 29.8, inside the oversold zone, while the downtrend remains intact.
Why Wilmar is in focus today
- RSI(14) at 29.8 — oversold zone
- Downtrend extending (5-day change -3.54%)
Selected automatically from 16 SGX (Singapore) stocks by a technical-signal score with daily weighted randomisation — not a recommendation.
Trend & Price Action
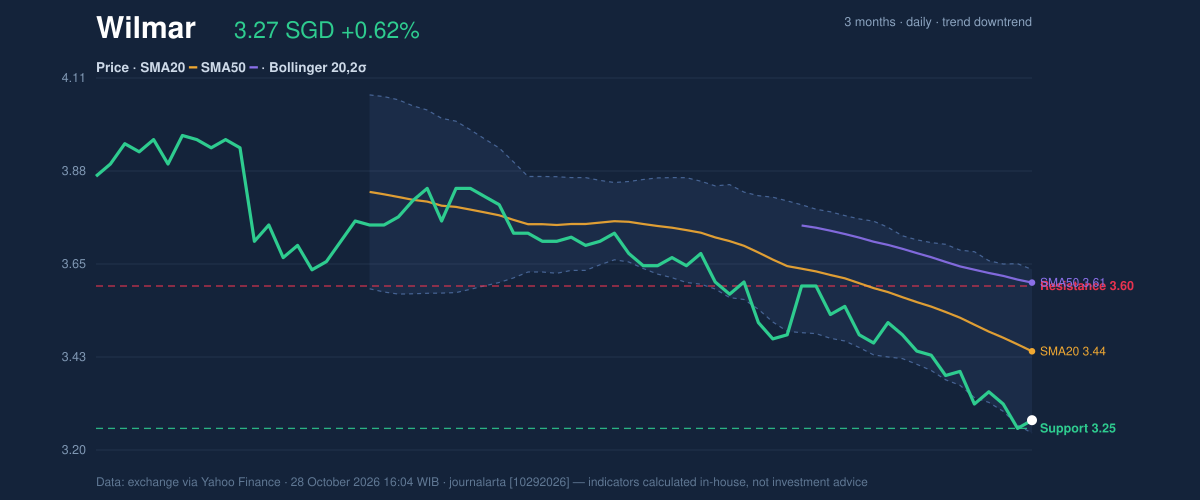
The shares trade below both the 20-day simple moving average (SMA20) at S$3.44 and the 50-day average (SMA50) at S$3.61, a layout that typically signals sellers have controlled the past several weeks. The SMA20 itself fell 2.34% over five days, which shows the average is still tilting lower rather than flattening. No new moving-average crossover has formed, so the trend reading rests on price position and slope, not on a fresh signal.
Within the 20-day range, the stock sits about 6% of the way up from the low, close to the floor of S$3.25 and far from the S$3.60 ceiling. The three-month range runs from a high of S$4.00 to a low of S$3.20, meaning Wilmar is trading only a few cents above its three-month bottom. As shown in the chart, price has been pressed against the lower Bollinger Band, with the 20-day average acting as a descending lid above it.
Oscillators & Momentum
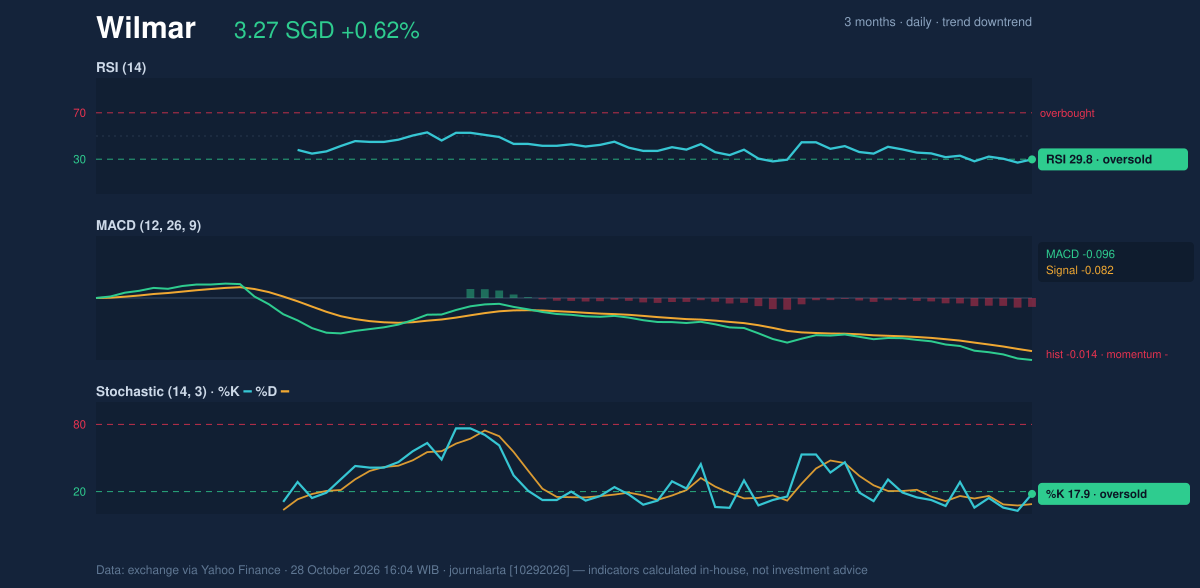
Momentum indicators agree with the price picture, though they also hint at stretched conditions. The Stochastic oscillator, which compares the close with the recent trading range, shows %K at 17.9 and %D at 8.8, both oversold. Readings this low mean the stock has been closing near the bottom of its recent range; they flag exhaustion risk but do not by themselves mark a turn.
The MACD line, which tracks the gap between short- and long-term averages, stands at -0.096 against a signal line of -0.082, leaving a histogram of -0.014. Negative and below its signal, it confirms that downside momentum has not yet reversed. The histogram is shallow, however, suggesting the pace of the decline is not accelerating sharply. As the chart shows, the oscillators are deep in the lower zone while MACD stays under water, a mix of stretched selling and unresolved weakness.
Volatility & Volume
Bollinger Bands, which draw a channel two standard deviations around the 20-day average, span S$3.24 to S$3.64 with the midline at S$3.44. The %B reading of 8% says the price is near the lower band, and the band width of 11.7% is normal, so there is no squeeze or sharp expansion at work. The Average True Range (ATR), a measure of typical daily movement, is S$0.08, or 2.3% of the price, a moderate level of volatility.
Volume on the latest session was 5,590,200 shares, about 1.1 times the 20-day average of 5,239,315. That is ordinary participation, not capitulation-style heavy trading. On-balance volume (OBV), which adds volume on up days and subtracts it on down days, is falling, so the money flow still favors sellers and does not yet corroborate the day's small gain.
Key Levels & Scenarios
Support at S$3.25 sits almost exactly where the stock closed the previous session, with the lower Bollinger Band at S$3.24 and the three-month low at S$3.20 stacked just beneath. A close below that cluster would open the way to fresh three-month lows. On the upside, the first hurdle is the SMA20 at S$3.44, followed by S$3.60, the 20-day resistance, which lies close to the SMA50 at S$3.61.
Technical Verdict: HOLD (wait & see)
The verdict is HOLD (wait & see), based on three readings: RSI at 29.8 and Stochastic at 17.9/8.8 show oversold conditions that argue against chasing the decline; yet MACD remains negative and OBV is falling, so there is no confirmed reversal; and price remains below SMA20 and SMA50 in a downtrend. The verdict is invalidated if price closes below S$3.20, the three-month low, which would confirm a deeper breakdown.
- Ideal entry range: S$3.24–S$3.27, the lower Bollinger Band to the current price, near 20-day support.
- Exit target: S$3.44 (SMA20) as the first level, S$3.60 (20-day resistance) as the second.
- Stop loss: below S$3.20, the three-month low.
In plain terms: Wilmar has fallen far and fast enough to look stretched, but the indicators have not yet shown that sellers are done, so the chart favors waiting for confirmation. This is technical analysis, not an investment recommendation.
| Indicator | Value |
|---|---|
| Last price | S$3.27 |
| SMA20 / SMA50 | S$3.44 / S$3.61 |
| Bollinger (upper/mid/lower) | S$3.64 / S$3.44 / S$3.24 |
| RSI(14) | 29.8 |
| Stochastic %K/%D | 17.9 / 8.8 |
| MACD / signal / histogram | -0.096 / -0.082 / -0.014 |
| ATR(14) | S$0.08 (2.3%) |
| Support / resistance (20 days) | S$3.25 / S$3.60 |
| 3-month high / low | S$4.00 / S$3.20 |
Summary Data Wilmar
| Last price | 3.27 SGD |
| Change 1 day / 5 days / 1 month | 0.62% / -3.54% / -9.42% |
| Trend / MA-cross | downtrend / none |
| SMA20 / SMA50 | 3.44 / 3.61 |
| RSI (14) / Stochastic %K | 29.8 / 17.9 |
| Bollinger %B / ATR | 8% / 0.08 |
| Support / Resistance 20 days | 3.25 / 3.60 |
| Data as of | 28 October 2026 16:04 WIB |
Disclaimer: This technical analysis is generated automatically from exchange data (via Yahoo Finance) and indicators calculated by JournalArta, for information and education only. The verdict and the entry, target and stop-loss levels are not investment advice or a solicitation to buy or sell any security. Investment decisions and their risks rest solely with the reader.
Track Wilmar share price daily: live levels, support/resistance and our full Wilmar analysis history.