China Mobile Testing Support Level: Stock Drops 0.06% (October 28, 2026)
On October 28, 2026: price 78.05 HKD, trend downtrend, RSI 40.7, support 77.10, resistance 81.00. technical analysis of china mobile stock.
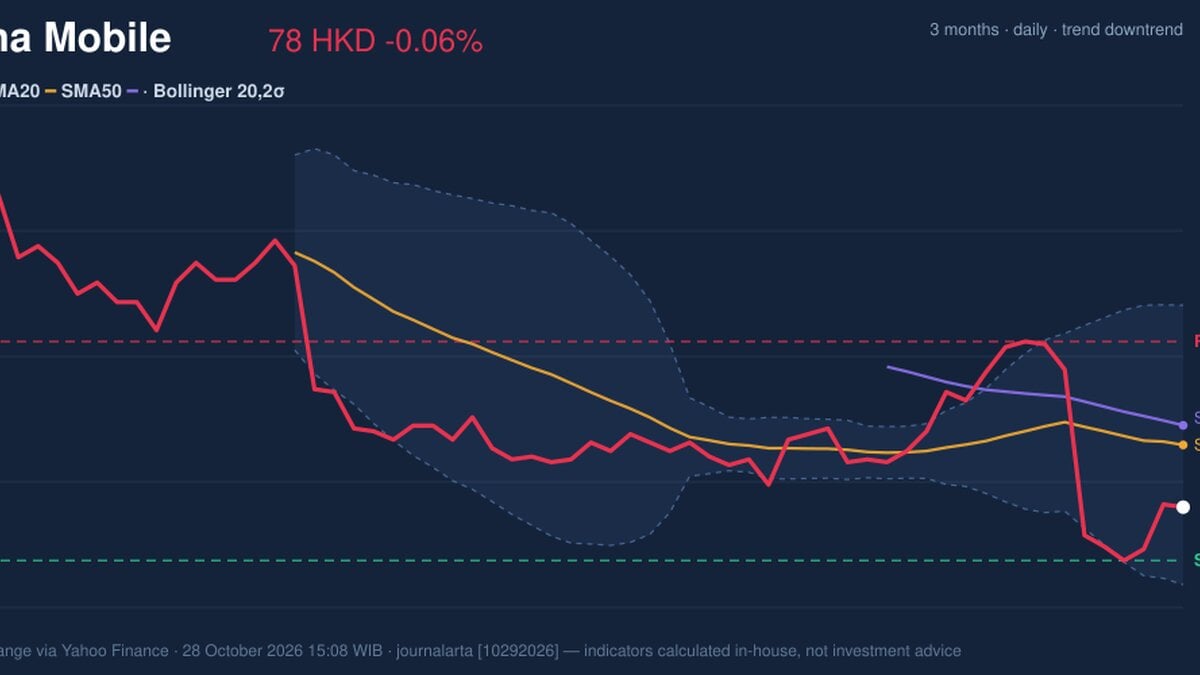
Why China Mobile is in focus today
- Trading near its 3-month low (77.00)
Selected automatically from 16 HKEX (Hong Kong) stocks by a technical-signal score with daily weighted randomisation — not a recommendation.
Trend & Price Action
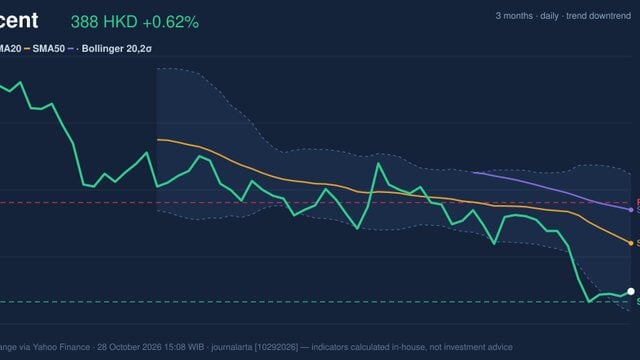
Small moves, but a clear direction. The price sits below its 20-day simple moving average (SMA20) of 79.16, which in turn sits below the 50-day average of 79.50. When the shorter average trails the longer one, recent buyers are paying less than earlier ones, a hallmark of a downtrend. The 20-day average itself fell 0.41% over five days, confirming the slope. No new moving-average crossover has formed. The stock trades at about 24% of its 20-day range, between support at 77.10 and resistance at 81.00. The three-month high of 84.95 is well out of reach, which shows how much ground has been given up from the peak.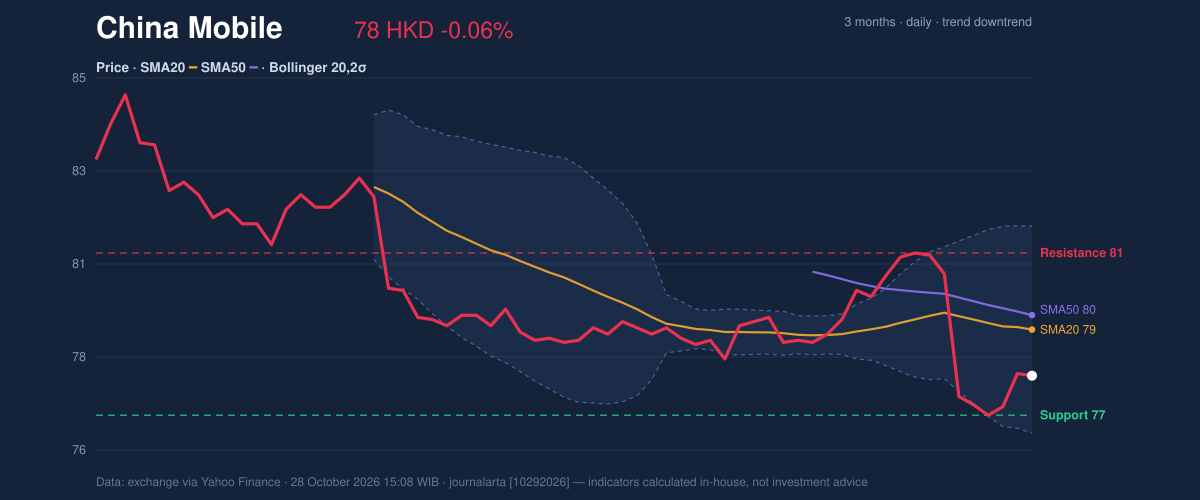
Oscillators & Momentum
Momentum is soft but not capitulating. The 14-day Relative Strength Index (RSI), which scales recent gains against losses from 0 to 100, reads 40.7, neutral. Readings below 30 usually flag heavy selling; this is nowhere near that. The Stochastic oscillator, which shows where the close sits within recent highs and lows, has %K at 22.6 and %D at 17.6. Both are neutral but leaning low, meaning closes are clustering near the bottom of the recent range. The MACD, a gauge comparing two moving averages of price, is at -0.480 against a signal line of -0.270, leaving a histogram of -0.210. That gap shows negative momentum that has not yet turned. Sellers still hold the edge, though the daily moves are tiny.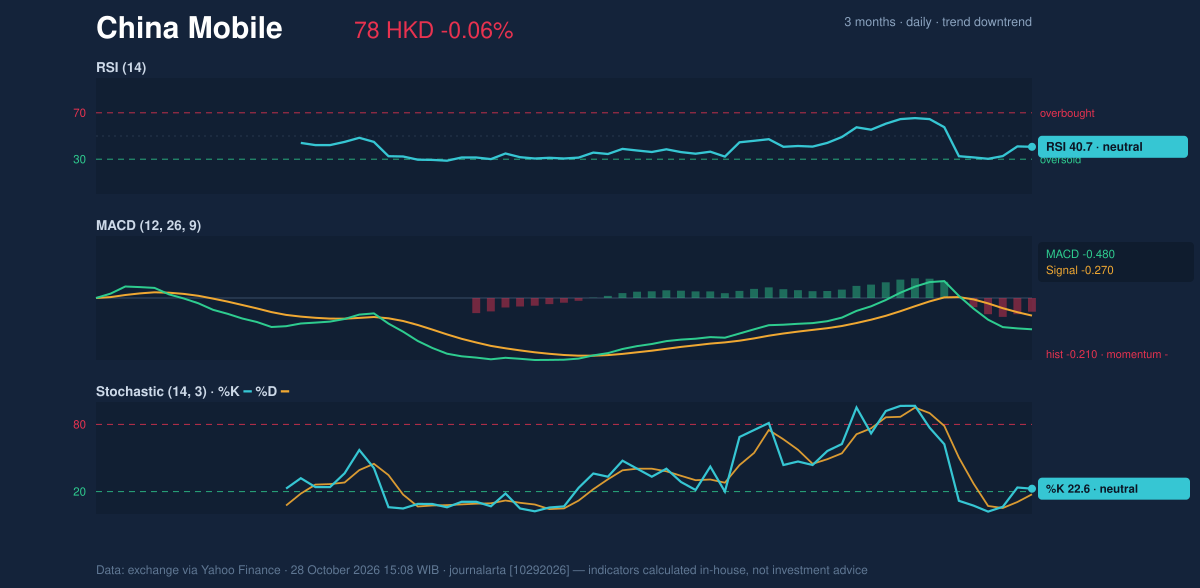
Volatility & Volume
The Bollinger Bands, a channel set two standard deviations around the 20-day average, run from 76.67 to 81.65. Their width has narrowed to 6.3% of price, a squeeze. Squeezes show quiet trading and often precede a larger move, though they do not reveal which way. The %B reading of 28% places price in the lower part of the channel, above the lower band at 76.67. The Average True Range (ATR), a measure of typical daily movement, is 1.01, or 1.3% of the price: low volatility. Volume of 13,165,519 shares was 0.9 times the 20-day average of 14,343,857, so the session drew slightly thin participation. On-balance volume (OBV), which tallies volume on up days versus down days, is falling, suggesting that the volume that does trade tends to come on declines.Key Levels & Scenarios
Support at 77.10 and the three-month low at 77.00 sit almost on top of each other, and the lower Bollinger band at 76.67 lies just beneath. A close below that cluster would open fresh three-month lows. A hold, by contrast, would keep the stock in a range, with the 20-day average at 79.16 the first hurdle and 81.00 resistance beyond it.Technical Verdict: HOLD (wait & see)
HOLD (wait & see) is the reading from the indicators, for these reasons:- The price is below both the SMA20 (79.16) and SMA50 (79.50), with a falling 20-day average, so the trend is down.
- The MACD histogram of -0.210 and falling OBV show momentum and volume still leaning negative.
- RSI at 40.7 and Stochastic at 22.6 are neutral, and the squeeze leaves direction unresolved, so neither side has a clear edge.
- Entry range: 77.10 to 78.05, near support, only if that floor holds.
- Exit target: 79.16 (SMA20) first, then 81.00 (20-day resistance).
- Stop loss: below 76.67, the lower Bollinger band, which also sits under the 77.00 three-month low.
Summary Data China Mobile
| Last price | 78.05 HKD |
| Change 1 day / 5 days / 1 month | -0.06% / 0.64% / -1.51% |
| Trend / MA-cross | downtrend / none |
| SMA20 / SMA50 | 79.16 / 79.50 |
| RSI (14) / Stochastic %K | 40.7 / 22.6 |
| Bollinger %B / ATR | 28% / 1.01 |
| Support / Resistance 20 days | 77.10 / 81.00 |
| Data as of | 28 October 2026 15:08 WIB |
Disclaimer: This technical analysis is generated automatically from exchange data (via Yahoo Finance) and indicators calculated by JournalArta, for information and education only. The verdict and the entry, target and stop-loss levels are not investment advice or a solicitation to buy or sell any security. Investment decisions and their risks rest solely with the reader.
Track China Mobile share price daily: live levels, support/resistance and our full China Mobile analysis history.