Yangzijiang Testing Support Level: Stock Gains 0.21% (October 28, 2026)
On October 28, 2026: price 4.79 SGD, trend sideways, RSI 39.1, support 4.78, resistance 5.21. technical analysis of yangzijiang stock. Yangzijiang Testing…
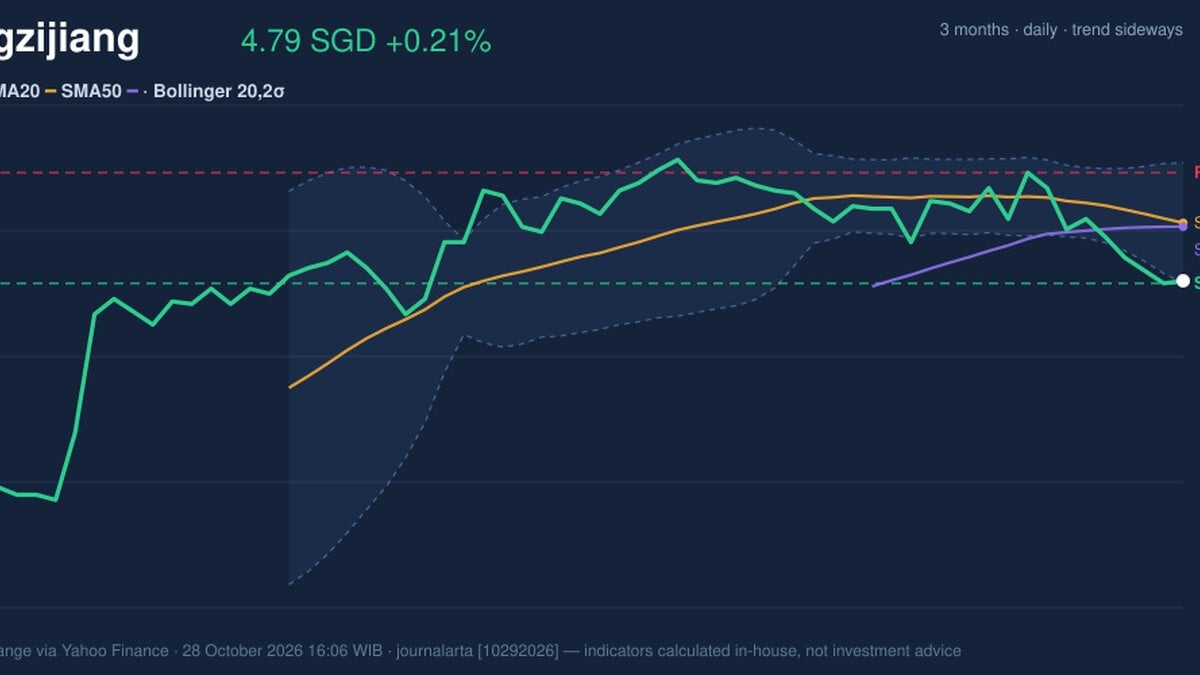
Yangzijiang Shipbuilding closed at S$4.79 on Wednesday, October 28, 2026, a gain of 0.21% on the day. That small uptick follows a drop of 4.77% over five days and 6.63% over one month, and it leaves the stock sitting on the edge of its lower Bollinger band, according to exchange data via Yahoo Finance.
Trend & Price Action
The stock is stuck. The 20-day moving average, which smooths out daily noise, fell 1.52% over five days to S$5.02, and the price sits below it. The 50-day average is at S$5.00, almost level with the shorter one. When two averages are this close, neither is leading the other, which is why the trend reads as sideways rather than a clear downtrend. No new moving-average crossover has formed.
Still, the price is below both averages, and that matters. It means buyers over the past month have paid more on average than today's price, and some of them may sell if the stock rallies back toward their entry. The nearest ceiling is the 20-day resistance at S$5.21, with the S$5.02 midline of the Bollinger bands as a first hurdle. The 20-day support is S$4.78, just one cent below the last close and level with the lower band.
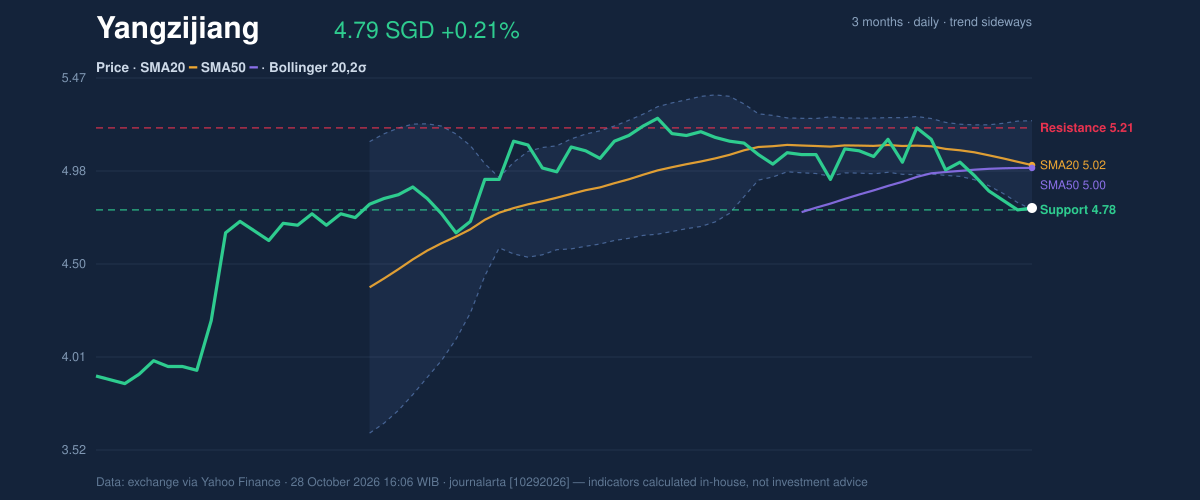
As the chart shows, the price is pressed against the floor of a range that extends to a three-month high of S$5.41 and a low of S$3.75. The stock sits in the bottom 2% of its 20-day range, so it is close to the bottom but well above the three-month low.
Oscillators & Momentum
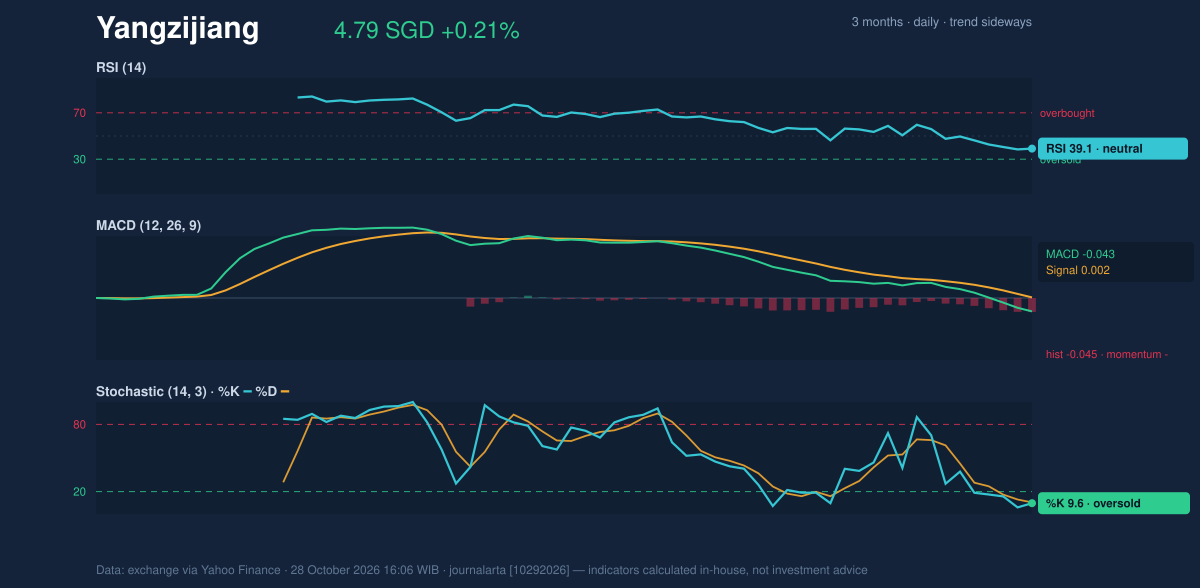
Momentum indicators lean weak but are stretched. The Stochastic oscillator, which compares the close with recent highs and lows, reads %K 9.6 and %D 10.4. Both are in oversold territory, meaning the stock has closed near its lows for several sessions. Oversold readings flag exhaustion, not a reversal; in a falling market they can stay low for a while.
The Relative Strength Index (RSI), another gauge of recent gains versus losses, is 39.1, which is neutral. That gap with the Stochastic is telling: selling has been persistent but not extreme in scale. The MACD, a measure of the gap between short- and long-term averages, is -0.043 against a signal line of 0.002. The histogram is -0.045, which points to negative momentum.
Volatility & Volume
The Bollinger bands span S$4.78 to S$5.25, a width of 9.3%, which is normal. The %B reading of 2% says the price is hugging the lower band. Average True Range (ATR), the typical daily swing, is S$0.15, or 3.1% of the price, so moves of that size are routine and should not be read as signals.
Participation is thin. Volume of 11,394,100 shares was 0.9 times the 20-day average of 13,120,385. On-balance volume (OBV), which adds volume on up days and subtracts it on down days, is falling. That suggests the latest bounce lacks conviction, since a real turn usually comes with heavier trading.
Key Levels & Scenarios
If the stock falls below S$4.78, it would break the 20-day support and the lower band together, and the next reference in the data is the three-month low of S$3.75. If it holds and climbs, S$5.02 is the first test, followed by S$5.21.
Technical Verdict: HOLD (wait & see)
The indicators point to HOLD (wait & see) for three reasons:
- The price is below the 20-day average, which is falling, and the MACD histogram is negative at -0.045.
- The Stochastic at 9.6 is oversold, which argues against chasing further weakness.
- OBV is falling and volume is below average, so the bounce lacks confirmation.
The verdict is invalidated if the price closes below S$4.78 (bearish) or rises above S$5.21 (bullish).
- Entry range: S$4.78 to S$4.79, near support and the lower band, if it holds.
- Exit target: S$5.02 first (SMA20 and band midline), then S$5.21 (resistance).
- Stop loss: below S$4.78, the 20-day support.
In plain terms: the stock is weak but looks stretched on the downside, so the data favors waiting for a clearer signal. This is technical analysis, not investment advice.
| Indicator | Value |
|---|---|
| Last price | S$4.79 |
| Change (1 day / 5 days / 1 month) | 0.21% / -4.77% / -6.63% |
| SMA20 / SMA50 | 5.02 / 5.00 |
| Bollinger (upper / mid / lower) | 5.25 / 5.02 / 4.78 |
| %B / band width | 2% / 9.3% |
| RSI(14) | 39.1 |
| Stochastic %K / %D | 9.6 / 10.4 |
| MACD / signal / histogram | -0.043 / 0.002 / -0.045 |
| ATR(14) | 0.15 (3.1%) |
| Volume vs 20-day average | 11,394,100 vs 13,120,385 (0.9x) |
| Support / resistance (20 days) | 4.78 / 5.21 |
| 3-month high / low | 5.41 / 3.75 |
Summary Data Yangzijiang
| Last price | 4.79 SGD |
| Change 1 day / 5 days / 1 month | 0.21% / -4.77% / -6.63% |
| Trend / MA-cross | sideways / none |
| SMA20 / SMA50 | 5.02 / 5.00 |
| RSI (14) / Stochastic %K | 39.1 / 9.6 |
| Bollinger %B / ATR | 2% / 0.15 |
| Support / Resistance 20 days | 4.78 / 5.21 |
| Data as of | 28 October 2026 16:06 WIB |
Disclaimer: This technical analysis is generated automatically from exchange data (via Yahoo Finance) and indicators calculated by JournalArta, for information and education only. The verdict and the entry, target and stop-loss levels are not investment advice or a solicitation to buy or sell any security. Investment decisions and their risks rest solely with the reader.
Track Yangzijiang share price daily: live levels, support/resistance and our full Yangzijiang analysis history.