AstraZeneca Stock Drops 0.43% Today, Momentum Weakens
On September 14, 2026: price 11,708.00 GBp, trend sideways, RSI 41.1, support 11,460.00, resistance 12,476.00. technical analysis of astrazeneca stock.

AstraZeneca shares on the LSE slipped to 11,708.00 GBp by 14:00 WIB on 11 September 2026, down 0.43% on the day and 2.48% over five days, according to exchange-linked data via Yahoo Finance. The move leaves the stock in a sideways pattern, but not a neutral one in the everyday sense: price is still trading below the SMA20 at 11,961.60 and well under the SMA50 at 12,377.08, which tells traders the medium-term tone remains soft even though the latest month is flat. The chart shows a market that is not breaking down aggressively, but is struggling to reclaim lost ground.
Trend & Price Action
The most important signal in the price structure is that AstraZeneca remains below both the SMA20 and SMA50, with no fresh moving-average cross to suggest a new trend is forming. That matters because a stock can drift sideways and still be technically weak if it keeps failing to recover above its short-term average. Here, the SMA20 slope is -0.04% over five days, a small decline that signals a market losing altitude rather than building a base. It is not a steep downtrend, but it is enough to show sellers still have the upper hand on rallies.
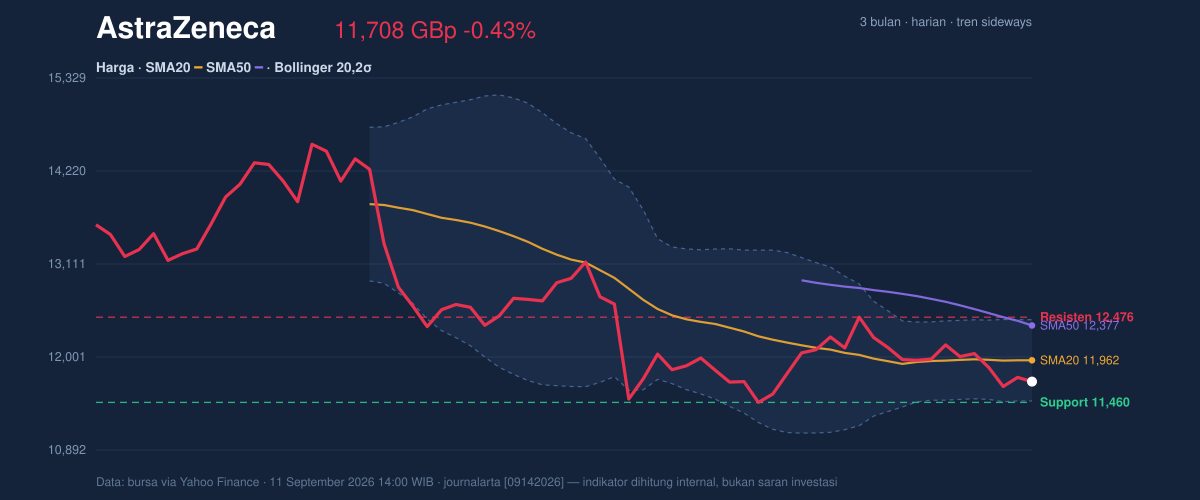
The Bollinger Band setup reinforces that reading. Price sits near the lower half of the band structure, with %B at 24%, meaning the shares are closer to the lower band than the upper band. The band width is 8.1%, described as normal, so this is not a compression setup that usually precedes an explosive move. Instead, it suggests the stock is trading in an ordinary range, with room to move but no strong volatility signal pointing to a breakout just yet.
The broader range also helps frame the current position. The stock is trading around the lower part of its recent band, with support at 11,460.00 and resistance at 12,476.00. At 11,708.00, AstraZeneca is closer to support than resistance, which usually means the market is waiting for either a bounce or a decisive break. The 3-month range, from 9,892.00 to 15,126.00, shows there is still plenty of historical room above and below, but the immediate question is whether the current floor can hold.
Oscillators & Momentum
The momentum picture is mixed, and that is what makes this name interesting right now. The RSI at 41.1 is neutral, so the stock is neither overbought nor oversold on that measure. In plain language, RSI is saying the market is not stretched enough to force a reversal, but it is also not strong enough to confirm a clean recovery. That leaves it in a waiting zone.
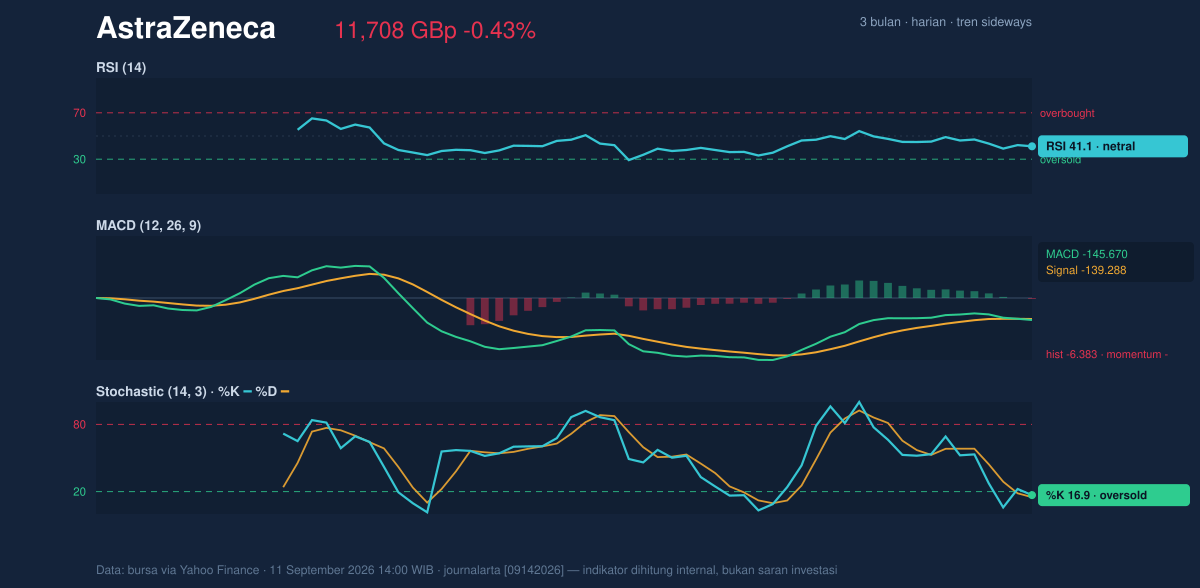
By contrast, stochastic momentum is far more compressed. The Stochastic %K at 16.9 and %D at 15.0 place the stock in oversold territory, which often means downside pressure has become short-term overdone. This does not guarantee a bounce, but it does show the stock is near a point where sellers may be tiring. The catch is that oversold readings can stay oversold in weak tape, so the signal is only useful if price starts to respond.
The MACD, however, still leans negative. With MACD at -145.670, the signal line at -139.288, and a histogram of -6.383, the message is that downside momentum is still present. The histogram being below zero means the faster line remains under the signal line, which is a classic sign that bearish pressure has not fully cleared. Put simply, stochastic says the stock is stretched short term, while MACD says the broader momentum has not yet turned.
Volatility & Volume
Volatility is present, but not extreme. The ATR(14) at 290.32, equal to 2.5% of price, points to moderate daily movement. That matters because it defines how quickly the stock can travel between levels without needing a major news catalyst. Combined with the normal Bollinger width, this suggests the current setup is more about direction than disorder.
Volume is less supportive. Last trade volume was 1,474,760, about 0.5x the 20-day average of 2,743,075, which means participation was light. Low volume on a weak close often implies conviction is limited, but it can also mean buyers are not yet stepping in with force. The OBV is falling, and that is the more important clue: on-balance volume tracks whether money flow is accumulating or leaving the stock, so a decline there suggests distribution rather than accumulation. In other words, rallies have not yet earned strong backing from trading activity.
Key Levels & Scenarios
The immediate technical map is straightforward. 11,460.00 is the first level to watch on the downside because it is the stated 20-hour support and sits just below the current price. If that level gives way, the stock would be vulnerable to a deeper test toward the lower Bollinger band at 11,476.76, which is already close enough to matter as a short-term magnet. On the upside, 12,476.00 is the key resistance. A move through that zone would be the clearest sign that the market is trying to repair the weak structure and push back above the short-term average.
The current positioning at 24% of the range suggests the stock is still leaning toward the lower end, not the middle, which is why the burden of proof remains on the bulls. A rebound would need to reclaim the SMA20 at 11,961.60 first, because that is the line separating a weak range from a more constructive one. Without that, any bounce risks being treated as a reaction rather than a trend change.
Technical Verdict: HOLD (wait & see)
HOLD (wait & see)
- MACD remains negative, so broader momentum has not turned up.
- Price is below the SMA20 and SMA50, which keeps the trend structure soft.
- Stochastic is oversold, but that is not yet confirmed by stronger volume or a reclaim of resistance.
Verdict invalidated if price breaks 11,460.00 on a sustained basis.
- Ideal entry range: 11,460.00 to 11,708.00
- Exit target: 11,961.60, then 12,476.00
- Stop loss protection: below 11,460.00
In plain English: the shares look stretched enough for a bounce, but not strong enough yet to confirm one.
The latest 3-month high is 15,126.00.
Summary Data AstraZeneca
| Last price | 11,708.00 GBp |
| Change 1 day / 5 days / 1 month | -0.43% / -2.48% / 0.00% |
| Trend / MA-cross | sideways / none |
| SMA20 / SMA50 | 11,961.60 / 12,377.08 |
| RSI (14) / Stochastic %K | 41.1 / 16.9 |
| Bollinger %B / ATR | 24% / 290.32 |
| Support / Resistance 20 days | 11,460.00 / 12,476.00 |
| Data as of | 11 September 2026 14:00 WIB |
