Testing Key Resistance, BP Stock Drops 0.09% Today
On September 14, 2026: price 564.60 GBp, trend uptrend, RSI 64.5, support 514.50, resistance 565.10. technical analysis of bp stock. Testing Key Resistance —…

International investors are watching whether BP plc can turn a near-term stretch into a cleaner breakout on the London market. The shares finished at 564.60 GBp, down 0.09% on the day, but the broader tape still points higher: the stock is up 4.61% over five days and 8.08% over one month, according to data from Yahoo Finance via the LSE feed.
The message from the chart is simple. BP is still in an uptrend, and the price remains above the SMA20 at 538.92 and above the SMA50 at 526.73. That matters because moving averages are a quick way to see whether recent buying has been strong enough to keep the stock above its medium-term base. Here, the slope of the SMA20 is rising at 1.44% over five days, which suggests the trend is not just intact but still gaining traction.
Trend & Price Action
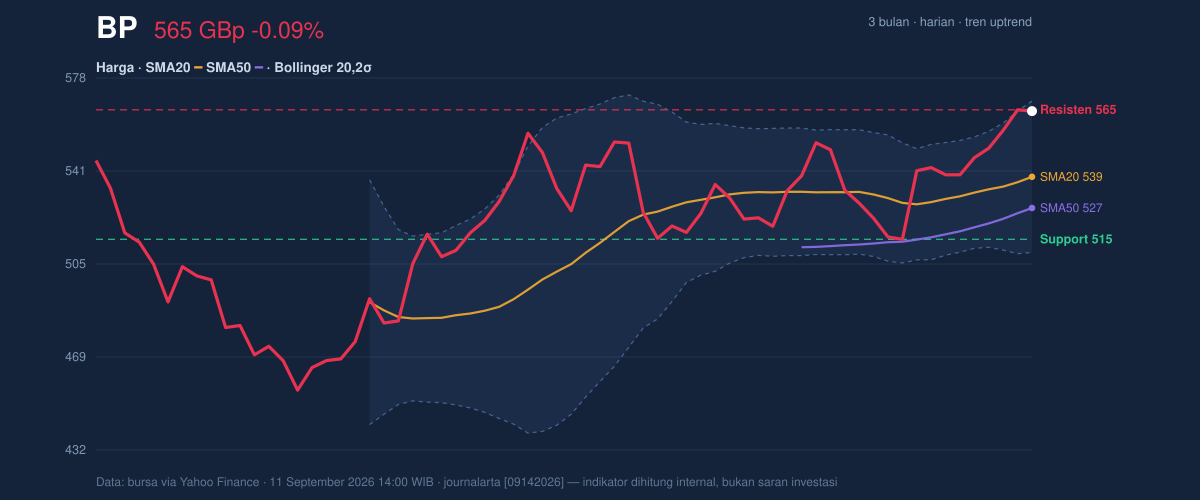
BP is trading very close to the top of its short-term range, with the latest price sitting at 99% of the 20-hour range. The immediate ceiling is the 20-hour resistance at 565.10, which is also just above the latest close. That proximity explains why the day’s move was flat rather than explosive: the shares are pressing against a level where previous sellers have already shown up.
The broader positioning is also notable. The stock is below the 3-month high of 572.50 but well above the 3-month low of 450.60. In plain terms, BP has recovered a large part of its recent trading band, but it has not yet cleared the upper edge that would signal a more decisive reset higher. The Bollinger upper band at 568.48 sits only a little above the current price, reinforcing that the shares are moving into the upper part of their recent envelope.
There is no fresh moving-average crossover to point to a new trend regime, but the existing structure remains constructive. When price stays above both short-term and medium-term averages, it usually means buyers are still willing to defend dips rather than waiting for a deeper pullback.
Oscillators & Momentum
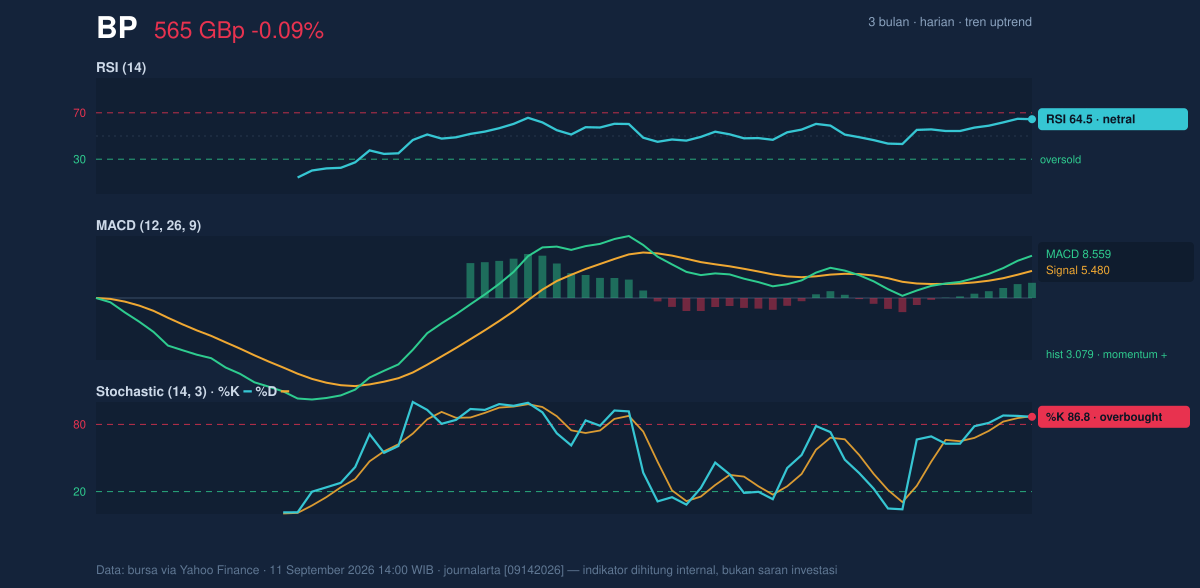
Momentum is positive, but it is also getting stretched. The RSI at 64.5 is still technically neutral, which means the stock is not yet in a classic overbought warning zone. But the Stochastic %K at 86.8 and %D at 87.4 are both in overbought territory, a sign the recent rally has moved fast enough that short-term traders may start taking profits on strength.
That split between indicators matters. RSI is telling us the trend still has room, while Stochastics are warning that the pace of the move is already extended. This is often what a healthy rally looks like near resistance: not a reversal signal by itself, but a reminder that the next leg higher may need fresh volume to continue.
The MACD at 8.559, with the signal line at 5.480 and a positive histogram of 3.079, confirms that upside momentum remains in place. In practical terms, MACD above its signal line means recent gains are still outpacing the slower trend measure. That is a supportive signal, especially when paired with the rising SMA20. The caution is that momentum is positive even as the stock approaches resistance, so the market is asking for confirmation rather than assuming follow-through.
Volatility & Volume
The volatility backdrop is moderate rather than explosive. BP’s ATR(14) is 16.24, or 2.9% of price, which suggests the stock can move, but not in a wild or disorderly fashion. The Bollinger band width of 11.0% is described as normal, meaning the shares are not in a squeeze that often precedes a sharp breakout, nor in an expanded volatility phase that would imply panic or euphoria.
Volume is the softer part of the story. The latest turnover of 25,225,408 was only 0.6× the 20-hour average of 45,122,581, so the market is not yet backing the price with strong participation. That matters because a stock pressing resistance on light volume can stall even when the trend is otherwise healthy. The positive counterweight is that OBV is rising, which indicates cumulative buying pressure has been improving even if the latest session itself was quiet.
In other words, the chart shows demand, but not full conviction yet.
Key Levels & Scenarios
The nearest levels are clear. Support at 514.50 is the key floor from the 20-hour range, while resistance at 565.10 is the immediate hurdle. Above that, the Bollinger upper band at 568.48 and the 3-month high at 572.50 become the next reference points.
If BP can hold above 565.10 with stronger volume, the chart would shift from “testing resistance” to “attempting a breakout,” especially because the trend and MACD already lean positive. If it fails to clear that zone, the risk is a pullback toward the rising middle of the Bollinger structure at 538.92, which is also the SMA20. A deeper loss of that area would weaken the short-term trend and bring 514.50 back into focus.
Technical Verdict: HOLD (wait & see)
HOLD (wait & see)
- MACD remains positive and above the signal line, which supports the existing uptrend.
- Price is above SMA20 and SMA50, and the SMA20 slope is rising, showing trend support.
- Stochastic is overbought and price is pressing resistance at 565.10, so upside needs confirmation rather than assumption.
Verdict invalidated if price falls below 514.50.
- Ideal Entry Range: 538.92 to 565.10
- Exit Target: 568.48 to 572.50
- Stop Loss protection: below 514.50
For non-traders: the shares still look technically healthy, but they are close to resistance and need a stronger move to prove the rally has more room.
BP’s next visible test is whether it can turn 565.10 into support as the shares approach the 3-month high of 572.50.
Summary Data BP
| Last price | 564.60 GBp |
| Change 1 day / 5 days / 1 month | -0.09% / 4.61% / 8.08% |
| Trend / MA-cross | uptrend / none |
| SMA20 / SMA50 | 538.92 / 526.73 |
| RSI (14) / Stochastic %K | 64.5 / 86.8 |
| Bollinger %B / ATR | 93% / 16.24 |
| Support / Resistance 20 days | 514.50 / 565.10 |
| Data as of | 11 September 2026 14:00 WIB |
