Shell Testing Key Resistance: Stock Gains 0.51% (September 14, 2026)
On September 14, 2026: price 3,551.00 GBp, trend uptrend, RSI 69.2, support 3,311.00, resistance 3,551.00. technical analysis of shell stock.

Shell plc’s shares on the London Stock Exchange rose to 3,551.00 GBp on 11 September 2026 at 14:00 WIB, edging above the previous close of 3,533.00 as the stock pressed into the top of its recent trading range. The move matters less for its size than for its location: Shell is now sitting at the edge of resistance, with technical indicators showing a market that is still constructive but increasingly stretched.
Trend & Price Action
The broader setup remains positive. Shell is trading above its SMA20 at 3,421.63 and also above the SMA50 at 3,300.11, which tells readers the stock is not merely bouncing but remains in an established upward structure. The uptrend is reinforced by the SMA20 slope of 1.53% over 5 days, a sign that short-term momentum is still rising rather than flattening out.
What makes the chart more interesting, as shown in the price action chart below, is that the stock is now effectively testing the ceiling of its near-term band. The upper Bollinger Band sits at 3,555.63, only just above the last price, while the 20-hour resistance is pinned at 3,551.00. That means Shell is trading at 100% of its 20-hour range, a position that usually signals strength but also leaves little room for error.
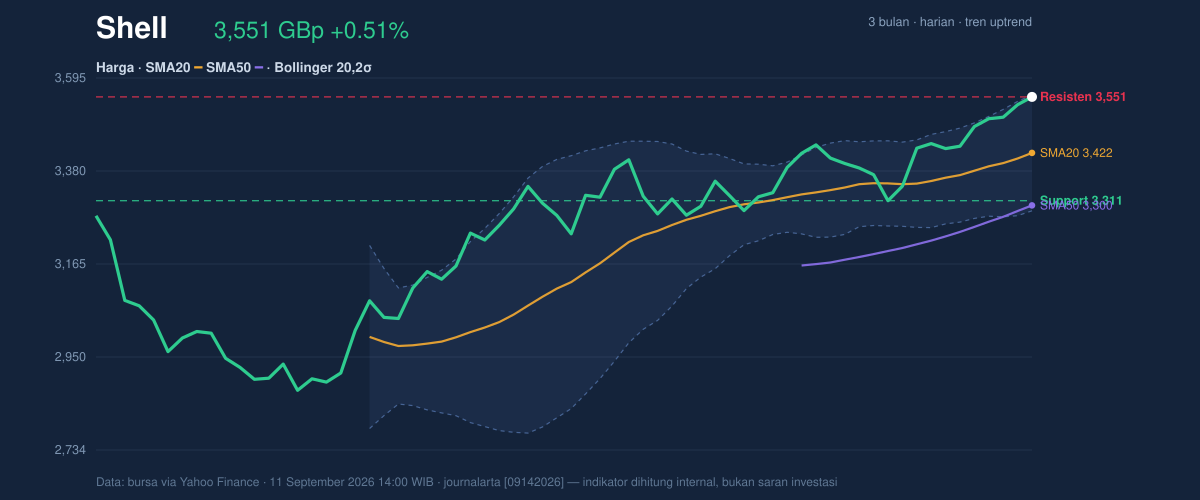
The longer-range context is still supportive. Shell is trading close to its 3-month high of 3,580.50 and well above the 3-month low of 2,559.50. In practical terms, the market is no longer debating whether the stock has recovered; it is now deciding whether the current advance has enough energy to extend beyond the recent peak.
Oscillators & Momentum
The momentum picture is split, and that split is the key signal. The RSI at 69.2 is technically still labeled neutral here, but it is close to the classic overbought zone, which means the stock has gained enough speed that further upside may become harder to sustain without a pause. By contrast, the Stochastic %K at 89.3 and %D at 84.9 are clearly overbought, suggesting short-term enthusiasm is elevated and the chart may be vulnerable to a cooling phase.
That does not mean the trend has turned weak. The MACD at 60.992 remains above the signal line at 51.620, with a positive histogram of 9.372. In plain English, the MACD is still confirming upward momentum: buyers remain in control, even if they are now paying up near the top of the recent range. As shown in the momentum chart, the main question is not whether the trend exists, but whether it can keep accelerating from here.
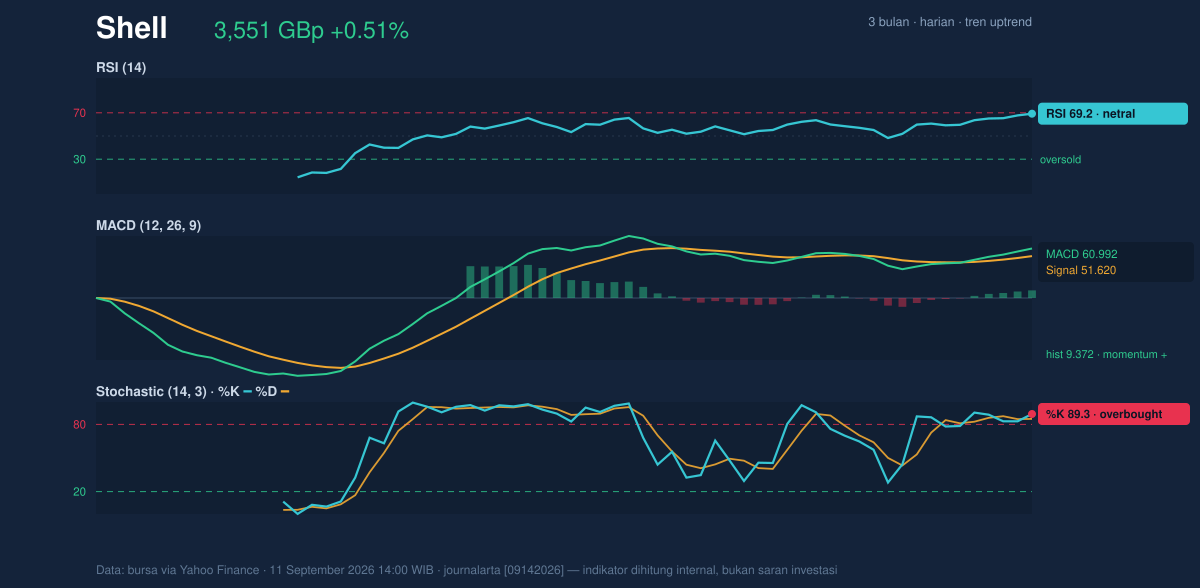
The combination of a strong MACD and overbought Stochastic readings often points to a market that is still rising, but increasingly dependent on fresh buying interest. If that demand fades, momentum can stall even while the broader trend remains intact.
Volatility & Volume
Volatility is not flashing alarm bells, but it is setting up for a possible move. The Bollinger Band width of 7.8% is relatively tight and described here as a squeeze, which often precedes expansion. That matters because Shell is already trading at %B 98%, meaning the price is hugging the upper band rather than sitting in the middle of the range. When a squeeze coincides with a price near the top band, the market is effectively coiled: the next move can be sharper than the recent day-to-day drift.
The ATR(14) of 57.18, equal to 1.6% of price, suggests volatility is moderate rather than extreme. So while the stock is stretched, it is not behaving like a panic-driven name; instead, it is moving in a controlled way that still leaves room for follow-through if participation improves.
That participation, however, is the weak spot. Last volume was 7,440,101, below the 20-hour average of 10,672,973, or 0.7x normal. In other words, the price is rising without full crowd support. The OBV is rising, which is constructive because it implies money flow has generally been supportive over time, but the latest tape is not showing a surge in conviction. That makes the breakout question more delicate: price is near resistance, indicators are positive, yet turnover is not confirming a decisive expansion.
Key Levels & Scenarios
The immediate reference points are clear. Support sits at 3,311.00, while resistance is 3,551.00. Because the last price is already at the resistance line, Shell is trading in a zone where continuation needs confirmation rather than assumption. A clean push through the upper Bollinger Band at 3,555.63 would strengthen the case that the market is trying to extend toward the 3-month high of 3,580.50. If that fails, the more likely reaction is a retreat toward the middle of the Bollinger structure at 3,421.63, and then potentially to 3,311.00 if momentum fades more sharply.
The signal to watch is whether the current squeeze resolves with volume. If price holds above the SMA20 and continues to close near the upper band, the chart remains bullish. If it slips back below the recent resistance area, the overbought Stochastic readings become more important, because they would suggest the market had run ahead of itself.
Technical Verdict: HOLD (wait & see)
HOLD (wait & see) — the trend is positive, but the stock is now stretched at resistance, with overbought short-term momentum and below-average volume.
- Reason 1: MACD is positive — the MACD 60.992 remains above the signal 51.620, so the broader momentum still favors the upside.
- Reason 2: Price is above the moving averages — Shell is holding above the SMA20 3,421.63 and SMA50 3,300.11, confirming the uptrend.
- Reason 3: Short-term indicators are stretched — the Stochastic %K 89.3 / %D 84.9 and %B 98% show the stock is pressing the top of its band, where pullbacks are common.
- Verdict invalidated if price falls below 3,311.00, which would break the stated support and weaken the current structure.
- Ideal Entry Range: 3,421.63 to 3,311.00
- Exit Target (Target Price): 3,555.63 to 3,580.50
- Stop Loss protection: below 3,311.00
For non-traders, this means Shell still looks technically healthy, but the share price is already near the point where the next move needs proof, not just momentum.
“Right now, the market is asking Shell to prove it can keep climbing, not just reach the summit.”
Summary Data Shell
| Last price | 3,551.00 GBp |
| Change 1 day / 5 days / 1 month | 0.51% / 3.32% / 8.00% |
| Trend / MA-cross | uptrend / none |
| SMA20 / SMA50 | 3,421.63 / 3,300.11 |
| RSI (14) / Stochastic %K | 69.2 / 89.3 |
| Bollinger %B / ATR | 98% / 57.18 |
| Support / Resistance 20 days | 3,311.00 / 3,551.00 |
| Data as of | 11 September 2026 14:00 WIB |
