LSEG Stock Analysis: Drops 0.24%, Golden Cross Formed
On October 28, 2026: price 9,186.00 GBp, trend uptrend, RSI 61.4, support 8,090.00, resistance 9,510.00. technical analysis of lseg stock.
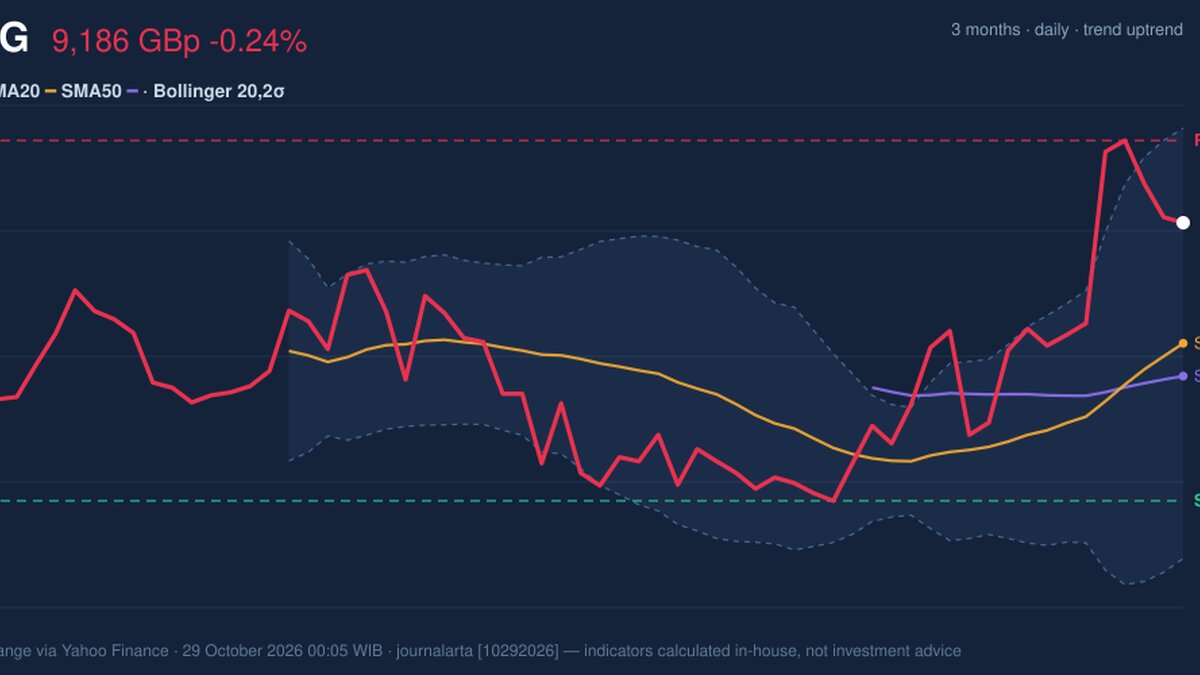
London Stock Exchange Group (LSEG) shares closed at 9,186.00 pence (GBp) on Wednesday, October 28, 2026, down 0.24% on the day from a previous close of 9,208.00, yet up 4.51% over five days and 12.57% over one month. The pullback is small. The bigger story is a golden cross, which formed three sessions before the latest session. That is when the faster 20-day moving average (SMA20) climbs above the slower 50-day (SMA50), a pattern traders read as a sign that recent prices are outpacing the longer-run trend.
Why LSEG is in focus today
- Fresh golden cross: SMA20 crossed above SMA50
- Uptrend confirmed (5-day change 4.51%)
Selected automatically from 16 LSE (UK) stocks by a technical-signal score with daily weighted randomisation — not a recommendation.
Trend and Price Action
The SMA20 stands at 8,711.10 and the SMA50 at 8,581.76, so the two averages are separated by only about 129 pence. The cross is real but young, and a narrow gap means a modest slip in prices could erode it quickly. The 20-day average rose 3.43% over five days, which shows the recent climb is lifting the average itself rather than just producing a single spike. The price sits above the SMA20, which keeps the trend classification at uptrend.
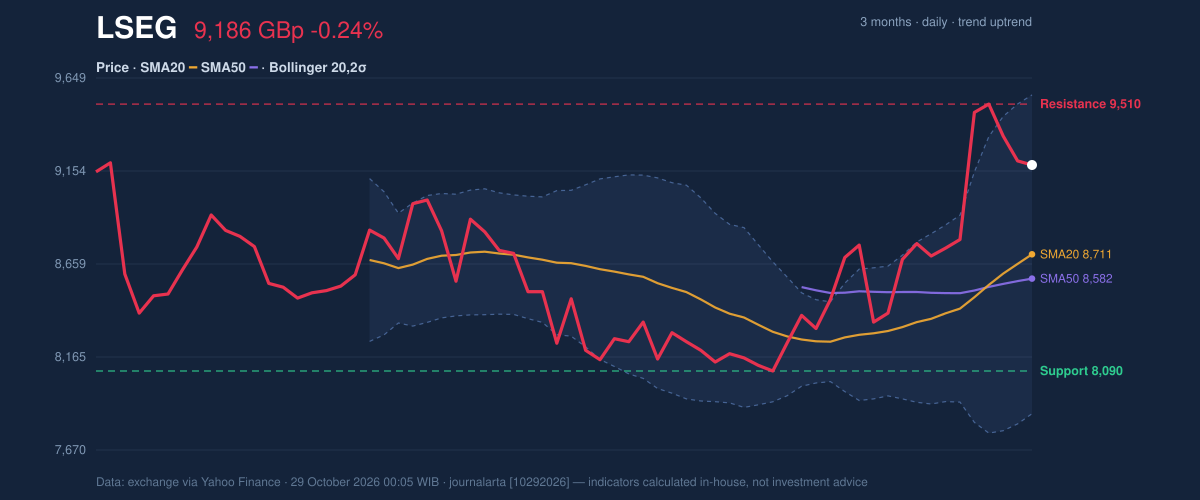
As the chart shows, the stock trades at roughly 77% of its 20-day range, between support at 8,090.00 and resistance at 9,510.00. It is also close to the three-month high of 9,568.00, against a three-month low of 8,012.00. In plain terms, the shares are near the top of where they have traded recently, so there is less room before they meet the ceiling that has capped earlier advances.
Momentum: Firm, Not Stretched
The RSI (14) reads 61.4, in neutral territory. The relative strength index measures how strong recent gains are compared with recent losses; readings above 70 usually flag an overheated market, so 61.4 indicates buying pressure without excess. The Stochastic oscillator shows %K at 72.1 and %D at 76.4, also neutral. That %K sits below %D is a mild caution, suggesting short-term momentum has cooled slightly after the run-up, consistent with Wednesday's small decline.
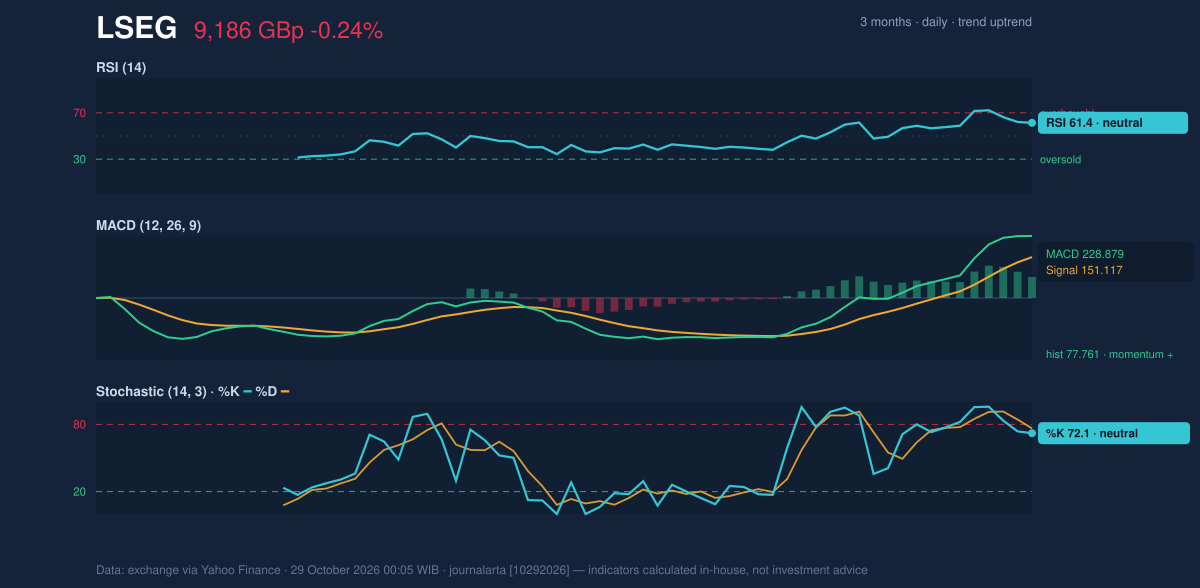
The MACD, a gauge comparing short- and long-term price averages, is at 228.879 against a signal line of 151.117. The histogram of 77.761 is positive, confirming that upward momentum remains in place. Taken together, the three oscillators agree with the trend, with only the Stochastic hinting at a pause.
Volatility and Volume
Bollinger Bands, which draw a channel two standard deviations around the 20-day average, span 7,863.09 to 9,559.11, with a middle line at 8,711.10. Band width is 19.5%, which is normal, and the %B of 78% places the price in the upper part of the channel without touching the upper band. The average true range (ATR), a measure of typical daily movement, is 314.45 pence, or 3.4% of the price, so moderate volatility. A swing of that size can easily span the distance between the current price and the nearby resistance.
Participation is the weak point. Wednesday's volume of 865,986 shares was only 0.6 times the 20-day average of 1,412,041. Rallies on thin trading are generally less convincing, since fewer buyers are behind the move. Offsetting that, on-balance volume (OBV), which tallies volume on up days against down days, is rising, indicating that accumulated buying has still outweighed selling.
Key Levels and Scenarios
The zone from 9,510.00 to 9,568.00 is the immediate test, combining the 20-day resistance, the three-month high and the upper Bollinger band at 9,559.11. A close above it on stronger volume would address the participation gap and extend the pattern. Failure to clear it would leave the shares range-bound. On the downside, the SMA20 at 8,711.10 is the first line to watch, followed by the SMA50 at 8,581.76 and support at 8,090.00. A drop through the two averages would put the golden cross in doubt.
Technical Verdict: HOLD (wait & see)
The verdict is HOLD (wait & see), for these reasons:
- The golden cross and rising 20-day average support the uptrend, but the cross is only three sessions old and the averages are close together.
- The price is near resistance at 9,510.00, with the Stochastic %K below %D, leaving limited room before a test.
- Volume at 0.6 times normal does not yet confirm the advance, even though OBV is rising.
The verdict would be invalidated if the price falls below the SMA50 at 8,581.76, or, on the upside, if it closes above 9,568.00 on solid volume.
- Ideal entry range: 8,711.10 to 8,581.76 (SMA20 to SMA50 area), on a pullback.
- Exit target: 9,510.00 to 9,559.11 (20-day resistance and upper Bollinger band).
- Stop loss: below 8,090.00 (20-day support).
In plain terms: the trend is positive, but the stock is already near its recent ceiling and trading is quiet, so the chart favors waiting for a clearer signal. This is technical analysis, not an investment recommendation.
| Indicator | Value |
|---|---|
| Last price | 9,186.00 GBp |
| Change (1 day / 5 days / 1 month) | -0.24% / 4.51% / 12.57% |
| SMA20 / SMA50 | 8,711.10 / 8,581.76 |
| Bollinger (upper / middle / lower) | 9,559.11 / 8,711.10 / 7,863.09 |
| RSI(14) | 61.4 |
| Stochastic %K / %D | 72.1 / 76.4 |
| MACD / signal / histogram | 228.879 / 151.117 / 77.761 |
| ATR(14) | 314.45 (3.4%) |
| Volume vs 20-day average | 865,986 vs 1,412,041 (0.6×) |
| Support / Resistance (20 days) | 8,090.00 / 9,510.00 |
| 3-month high / low | 9,568.00 / 8,012.00 |
Summary Data LSEG
| Last price | 9,186.00 GBp |
| Change 1 day / 5 days / 1 month | -0.24% / 4.51% / 12.57% |
| Trend / MA-cross | uptrend / golden |
| SMA20 / SMA50 | 8,711.10 / 8,581.76 |
| RSI (14) / Stochastic %K | 61.4 / 72.1 |
| Bollinger %B / ATR | 78% / 314.45 |
| Support / Resistance 20 days | 8,090.00 / 9,510.00 |
| Data as of | 29 October 2026 00:05 WIB |
Disclaimer: This technical analysis is generated automatically from exchange data (via Yahoo Finance) and indicators calculated by JournalArta, for information and education only. The verdict and the entry, target and stop-loss levels are not investment advice or a solicitation to buy or sell any security. Investment decisions and their risks rest solely with the reader.
Track LSEG share price daily: live levels, support/resistance and our full LSEG analysis history.